I. Introduction
When fiduciaries breach their duties under ERISA, the core question becomes: how do you calculate the loss? Every excessive-fee or imprudent-investment case boils down to one formula: what participants actually earned vs. what they should have earned under a prudent alternative. In other words, fiduciary damages in 401(k) plans are counterfactual—they measure what the plan would have earned “but for” the breach.
Recent academic and legal work—from Alex Bailey’s Allocating the Burden of Proving Loss-Causation in ERISA Fiduciary Litigation (Ill. L. Rev. 2023) to Vahick Yedgarian’s Quantitative Analysis of Damages in ERISA Fiduciary Breach Litigation (IAU 2024)—provides the structure for a more consistent approach to calculating damages. When applied to fixed annuities and stable-value products, these methods show how insurers’ spread-based profits translate directly into quantifiable losses for plan participants.
II. The Legal Foundation: Breach, Loss, and Causation
ERISA §409(a) makes fiduciaries personally liable to “make good to the plan any losses.” Courts universally require proof of three elements: breach, loss, and causation. Once breach and loss are shown, many appellate courts shift the burden to the fiduciary to prove the loss was not caused by the breach, consistent with trust-law fairness.
III. The Economic Foundation: Quantitative Models of Damages
Vahick Yedgarian and Ram Paudel show that ERISA damages are quantitative, not theoretical. Courts rely on four main financial models:
1. Fee-Differential Model – Excess administrative fees compounded over time.
2. Benchmark Comparison – Difference between prudent index return and actual fund performance.
3. Credit-Spread Model – Difference between insurer portfolio yield and credited rate.
4. Per-Participant Benchmark – Difference between charged vs. market median fees for similar plans.
Each builds a counterfactual: what would have happened had the fiduciary acted prudently.
IV. Fixed Annuities and the Stable Value Efficient Frontier
In Safe Annuity Retirement Products and a Possible U.S. Retirement Crisis (Lambert & Tobe, 2024), insurer-issued fixed and general-account annuities sit below the efficient frontier for retirement-plan investments—low return, high risk, and hidden spread profits. If an insurer credits 2% while benchmarks yield 4%, participants lose 200 bps per year—20% over a decade.
Formula:
Damages = Σ[(R_benchmark – R_annuity) × A_t-1]
Each year’s shortfall accumulates into recoverable loss under ERISA §409(a).
V. Disclosure Failures Compound the Damage
Peter Wiedenbeck’s Inconceivable? – Understandable ERISA Disclosures (2025) argues plan disclosures have become incomprehensible legal boilerplate. This opacity hides spread profits and excessive fees. Wiedenbeck calls for standardized, Truth-in-Lending-style disclosures so participants can see the real yield vs. credited rate.
VI. Procedural Barriers: Twombly, Iqbal, and the Locked Courthouse Door
Lauren Valastro’s How Misapplying Twombly Erodes Retirement Funds (2024) shows that courts’ “probability pleading” standards block many excessive-fee claims before discovery. Her data show high appellate reversal rates, confirming that well-defined benchmarks like the Stable Value Efficient Frontier are essential to surviving dismissal.
VII. The Unified Damages Framework
Bailey (2023): shifts burden of proof to fiduciary once breach and loss shown.
Yedgarian & Paudel (2024): quantitative financial models for fees and performance.
Wiedenbeck (2025): exposure of opaque disclosures masking losses.
Valastro (2024): procedural obstacles and benchmarks.
Tobe & Lambert (2024): efficient frontier as risk-return fiduciary standard.
VIII. Visualization: The Stable-Value Efficient Frontier
See https://commonsense401kproject.com/2025/10/30/the-stable-value-efficient-frontier/ The chart shows:
– Points on the frontier = prudent investments.
– Points below the frontier = insurer annuities with higher risk, lower return.
The vertical gap equals damages—the unearned spread retained by insurers.
IX. Conclusion: Turning Fiduciary Breaches into Quantified Justice
Fiduciary imprudence causes measurable economic harm. Using quantitative models and the Stable Value Efficient Frontier, participants and experts can finally demonstrate the gap between credited rates and prudent benchmarks as both a prohibited transaction and a quantifiable loss. ERISA provides the remedy; the math provides the proof.
References
1. Alex Bailey, Allocating the Burden of Proving Loss-Causation in ERISA Fiduciary Litigation, 2023 U. Ill. L. Rev. 991.
2. Vahick A. Yedgarian & Ram Paudel, Quantitative Analysis of Damages in ERISA Fiduciary Breach Litigation, Int’l Am. Univ. (2024).
3. Peter J. Wiedenbeck, Inconceivable? – Understandable ERISA Disclosures, Elder L.J. (2025 forthcoming).
4. Lauren K. Valastro, How Misapplying Twombly Erodes Retirement Funds, U. Colo. L. Rev. (2024).
5. Thomas E. Lambert & Christopher B. Tobe, “Safe” Annuity Retirement Products and a Possible U.S. Retirement Crisis, Journal of Economic Issues (2024).
Appendix: Detailed Damage Calculation Methodologies
A. Mutual Fund Share-Class Violation
Overview: When a plan fiduciary offers a higher-cost mutual fund share class when a lower-cost, identical (or materially equivalent) institutional or omnibus share class was available, the damage for plan participants is the incremental cost paid (via higher expense ratio) compounded over time, against the counterfactual of the lower-cost class.
Legal basis:
- Tussey v. ABB, Inc. (W.D. Mo. Mar. 31, 2012) held that the fiduciary breached duties by selecting higher-expense share classes when cheaper equivalent classes were available. McGuireWoods
- The statutory driver is ERISA § 409(a) (fiduciary liable for “any losses to the plan resulting from” each breach).
Calculation steps:
- Identify the challenged share class and available lower-cost share class (same fund strategy, same manager, same underlying portfolio).
- Determine the annual expense ratio differential:

- For each relevant year t, estimate the plan assets invested in that fund share class at the beginning (or average) of year t:
.
- Annual cost differential =
.
- Accumulate (compound) or actuarially discount (depending on approach) the series of annual cost differentials over the damage period
to
.

Where is an appropriate discount or benchmark rate.
- Optionally, subtract any rebates or offset credits actually returned to the plan.
Example: Suppose a plan had $100 million in Fund X higher-cost share class in 2015, with and
.
.
- Annual cost differential for 2015 = $100 m × 0.0030 = $300 000.
- If the balance grew or if multiple years apply, you compound accordingly.
Key issues:
- Ensuring true “equivalent” share class (investment strategy, manager, performance net of fees).
- Selecting appropriate benchmark growth rate or discount rate.
- Addressing offsets or rebates.
- Properly measuring plan assets in that share class over time.
- Demonstrating causation — that the fiduciary had access to the lower-cost share class or reasonably should have.
B. Performance-Related Damages
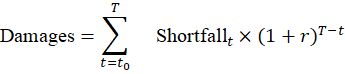
Overview: Fiduciary breach via imprudent investment selection or monitoring can cause performance “shortfalls” relative to a prudent alternative benchmark. The damage is measured as the difference between what participants actually earned and what they would have earned under the counterfactual prudent portfolio.
Legal/Academic basis:
- Fiduciary liability under ERISA §409(a) requires showing breach, loss, and causation. The CommonSense 401k Project+2Encore Fiduciary+2
- The academic piece “Calculating damages in ERISA litigation” details methodology for this type of loss. SSRN
Calculation steps:
- Define the actual investment option(s) and their historical net-of-expense returns by year:
.
- Define the counterfactual prudent benchmark return by year:
. (E.g., a comparable index or peer group median.)
- For each year t, identify the plan assets invested in that option at the beginning (or average):
.
- Shortfall in year t:

- Aggregate over the period, compounding or discounting as appropriate:
- Adjust for offsetting factors (e.g., subsequent recovery of performance, contributions/withdrawals dynamics).
Example: A fund underperformed the index by 1% per annum over $50 million invested for 5 years.
- Year 1 shortfall = 0.01 × $50m = $500k, Year 2 based on new beginning balance etc., compound accordingly.
- Over five years the cumulative loss may approximate $500k × 5 = $2.5m, plus compounding.
Key issues:
- Selecting a proper benchmark (risk-adjusted, identical asset class).
- Handling participant flows, asset timing, and reallocation during the period.
- Ensuring causation: that the underperformance was caused by fiduciary breach (e.g., imprudent due-diligence, failure to remove under-performing options).
- Avoiding hindsight bias: ERISA requires a prudent process, not a “perfect” outcome. Encore Fiduciary
C. Record-Keeping and Service Vendor Damages
Overview: Fiduciary breach regarding service provider arrangements (record-keeping, vendor fees, revenue sharing) can lead to overpayment by plan participants. The damage equals the excess fees paid (“but for” more reasonable arrangements) compounded over time.
Legal basis:
- The duty of prudence includes monitoring vendor compensation, fee reasonableness, benchmarking. ErisA Practice Center+1
- Courts have held such arrangements can lead to recoverable losses under ERISA §409(a).
Calculation steps:
- Determine the actual per‐participant recordkeeping/service fee paid each year:
.
- Estimate a reasonable per-participant fee for comparable services:
(based on market comparators).
- Multiply by participant counts or total participants with accounts (P_t):

- Alternatively, calculate total plan assets × excess basis, if fees are asset-based rather than per-participant.
- Aggregate/compound across years:

- Adjust for rebates, credits, or other offsets (e.g., revenue-sharing offsets returned to plan).
Example: Suppose recordkeeper charged $80 per participant in year 1, market reasonable is $50. With 1,000 participants: excess fee = ($80-$50)×1,000 = $30,000 for year 1. Repeat for subsequent years, accounting for growth or changes.
Key issues:
- Establishing a credible “reasonable” fee benchmark for the same service scope and plan size.
- Timing and participant counts (fee base change).
- Demonstrating causation: that fiduciary failed to monitor/benchmark, board approved unreasonable fees.
- Recognizing that not every higher vendor fee constitutes loss—fiduciary might show value for higher cost.
D. Fixed Annuity / General-Account Insurance Product Damages (e.g., comparing to higher-return products such as TIAA Real Estate Account)
Overview: When a plan offers a fixed annuity or stable-value product with a credited rate materially below what similarly prudent investments or alternatives would have yielded, the difference can be shown as a shortfall. This is especially relevant where the insurer retains spread (i.e., difference between portfolio return and credited rate) and the fiduciary fails to evaluate that spread or alternatives.
Legal and economic basis: I refrenced in my article the “stable-value efficient frontier” concept and fixed-annuity under-performance relative to alternatives. https://commonsense401kproject.com/2025/10/30/the-stable-value-efficient-frontier/
Calculation steps:
- Determine actual credited rate of the fixed annuity product each year:
.
- Determine the benchmark return of a prudent alternative portfolio (e.g., similarly safe investment, index of general-account portfolios, or a real-estate heavy strategy such as TIAA Real Estate). Call it
.
- Estimate the asset amount invested in the fixed annuity each year:
.
- Annual shortfall =
.
- Aggregate/compound across years:

- Consider offsets (e.g., surrender charges, liquidity constraints, risk profile differences) and assess prudence of offering alternatives.
Example: If the fixed annuity credited 2 % in a given year, while a prudent alternative returned 4 %, the shortfall is 2 % on the invested assets. If $20 million was invested: shortfall = $400k that year. Over multiple years with compounding = significant.
Key issues:
- Justifying selection of the “alternative” return (must reflect comparable risk/liquidity constraints).
- Accounting for liquidity, benefit-design features (fixed annuity may offer certain protections others do not).
- Demonstration that fiduciary failed to evaluate comparative returns or disclose spread.
- Establishing that the plan could have taken the alternative and that participants were harmed.
E. Disgorgement in Prohibited Transaction Cases
Overview: When a fiduciary engages in a transaction prohibited under ERISA §406 that benefits a party in interest (or pays an unreasonable fee to a party in interest), the remedy may include disgorgement of profits made by that party or return of the excess benefit to the plan.
Legal basis:
- ERISA § 502(a)(2) allows recovery of “equitable relief” on behalf of the plan.
- Prohibited transactions under § 406(a) and (b) trigger § 409 fiduciary liability for losses plus disgorgement where appropriate.
- Courts have treated disgorgement as separate from but complementary to compensatory damages.
Calculation approach:
- Identify the prohibited transaction (e.g., a revenue-sharing arrangement with a party in interest, a cross-subsidization).
- Quantify the benefit retained by the party in interest (e.g., excess spread, underwriting margin, “kick-back” revenue). Call it
per year.
- Determine the time period that the profit was retained without offset to the plan.
- Disgorgement amount =
, optionally compounded as appropriate.
- If the plan itself also suffered measurable losses (as in prior sections), the remedy may include both compensatory damages and disgorgement of the profit to the plan.
Example: If a recordkeeper retained $500k each year for five years via revenue sharing from mutual funds, absent offset rebates to the plan, the disgorgement claim may sum $2.5 m.
Key issues:
- Demonstrating the party in interest was enriched and that the plan was deprived of the benefit.
- Ensuring that the disgorgement does not constitute a punitive damage but rather restitution to the plan (ERISA prohibits punitive damages). Finseca
- Aligning timing, accounting for offsets, and documenting causation.
F. Forfeiture Damages / Forfeiture Account Misuse
Overview: Forfeiture accounts—unvested participant balances forfeited upon termination—must be used in a manner consistent with plan terms and fiduciary duties (e.g., to reduce employer contributions or plan expenses). Misuse or failure to allocate forfeitures may give rise to losses to the plan or participants.
Calculation concept:
- Quantify the total forfeitures that should have been applied to plan expenses or employer match offset but were instead used incorrectly or retained by another party:
each year.
- Determine the lost benefit to participants or the plan (e.g., higher plan expense load, lower employer contributions).
- Aggregate over the relevant period; apply compounding/discounting as appropriate.
- If applicable, combine with other damage types (fee or performance losses) that resulted because of the misuse.
Example: If $200k in forfeitures was collected each year but not used to offset plan expenses, and the plan instead charged participants that $200k in higher net fees, then each year the damage equals $200k (or more if compounding).
Key issues:
- Plan document must clearly state permitted use of forfeiture.
- Demonstration of actual misuse and link to participant harm.
- Participant flows and allocation complexity (some participants leave before litigation settlement).
Summary Table of Damage Types
| Damage Type | Primary Metric | Counterfactual Benchmark | Key Data Inputs |
| Share-Class Excess Fee | Expense Ratio Differential × Assets | Lower-cost identical share class cost | Actual ER, Benchmark ER, Assets by share class |
| Performance Shortfall | (Benchmark Return – Actual) × Assets | Passive or peer-group index return | Actual returns, Benchmark returns, Assets |
| Recordkeeping / Vendor Excess Fee | (Actual Fee – Reasonable Fee) × N | Market reasonable fee per participant or asset basis | Fees, Participant count, Benchmark fee data |
| Fixed Annuity Shortfall | (Alternative Return – Credited Rate) × Assets | Prudent portfolio return for comparable risk | Credited rate, Alt return, Assets |
| Disgorgement / Prohibited Profit | Enrichment to party in interest | N/A (restitution measure) | Payment streams, Revenue sharing data |
| Forfeiture Misuse Loss | Forfeitures mis-applied | Proper allocation usage to reduce plan expenses | Forfeiture amounts, actual use vs. permitted use |
