My wife and I are parents of an autistic daughter. Medicaid waiver services are an essential part of how we meet her needs and plan for her future.
When Washington debates Medicaid, we hear something more concrete than competing budget numbers. We hear questions about whether families can find caregivers, whether community services will remain available, and whether adults who need substantial support will have somewhere safe to live when their parents can no longer care for them.
Kentucky’s Senate candidates, Andy Barr and Charles Booker, should be judged on how their policies answer those questions.
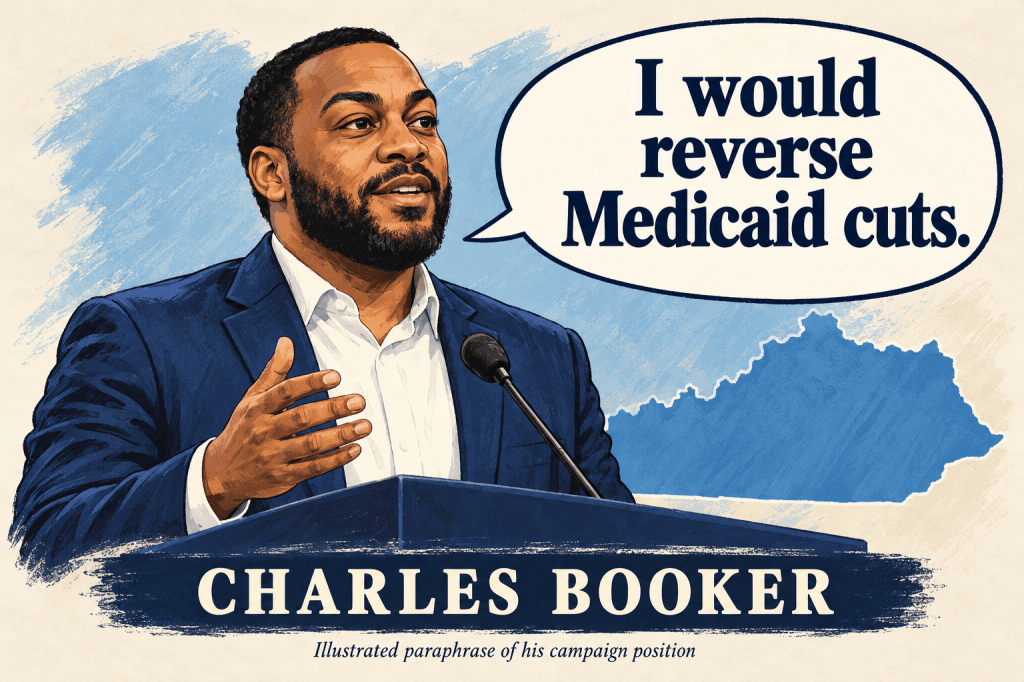
The record shows a clear difference. On July 3, 2025, Barr voted for final House passage of the One Big Beautiful Bill Act, which President Trump signed the following day. Booker’s campaign explicitly calls for reversing the law’s Medicaid cuts. One candidate helped enact the changes; the other promises to reverse them.
Voters deserve to understand what that difference means.
KFF reports that the Congressional Budget Office estimated the legislation would reduce federal Medicaid spending by approximately $911 billion over 2025–2034 compared with the previous legal baseline. This is a substantial withdrawal of federal support relative to what otherwise would have been provided.
Barr has defended the legislation as protecting Medicaid against fraud, waste, and abuse. He has also argued that Medicaid spending will continue growing over the next decade.
Spending can rise in dollars while falling substantially below the amount projected under prior law. Population needs, medical costs, and caregiver wages do not stop increasing because Congress changes a funding formula. A growing national spending total does not establish that Kentucky will have sufficient resources to sustain access to care.
The relevant question is whether people can actually obtain the services they need.
That matters especially for home and community-based services. Most of these services are optional under federal Medicaid law, and states can limit waiver enrollment and spending. KFF warns that federal funding reductions could lead states to serve fewer people, reduce benefits, or lower provider payments.
“Optional” is a budget classification. For a family depending on personal care, respite, behavioral support, or residential assistance, these services can be indispensable.
Nor does an exemption from work requirements settle the issue. Kentucky says the requirements beginning January 1, 2027, apply principally to Medicaid expansion adults, with exemptions including people with disabilities and qualifying caregivers. Those protections matter. They do not guarantee adequate funding for waiver services or an available caregiver.
Kentucky has already demonstrated how fragile this system can be. In July, Governor Andy Beshear announced that unexpected revenue would prevent a planned 4% Medicaid provider fee schedule reduction and address underfunding of existing Michelle P. waiver slots. That was a separate state budget dispute, and it should be described accurately. It also showed that maintaining services requires actual money and deliberate policy choices.
Booker’s commitment to reverse the federal Medicaid cuts addresses that funding problem more directly than assurances that the program remains protected.
Kentucky’s next senator must also recognize the connection between family caregiving and the broader economy. When reliable support disappears, someone must fill the gap. Often that means a parent reducing work, leaving employment, or postponing retirement. The need remains even when public funding retreats.
For my family, planning for our daughter’s future requires services we can depend on over many years. Kentucky deserves a senator prepared to make that same long-term commitment—and willing to be held accountable for delivering it. Charles Booker is that Senator.
Massie deserves credit for challenging his own party’s leadership and helping force disclosure of the Epstein files. His defeat should never become permission for Washington to abandon the investigation or protect powerful people from scrutiny.
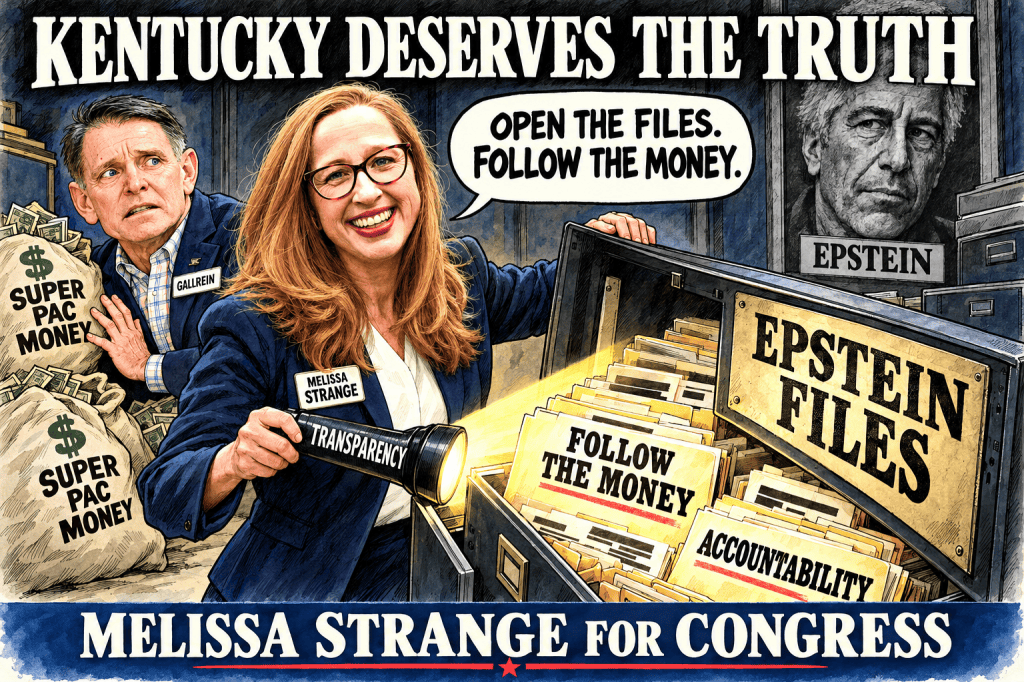
Melissa Strange has made her position explicit. Her campaign platform calls for releasing the Epstein files and prosecuting perpetrators. She also supports restrictions on congressional stock trading, a ban on members becoming lobbyists, and campaign finance reform. These are public commitments voters can use to hold her accountable.
Her Republican opponent, Ed Gallrein, benefited from an outside spending operation that has strong connections to Jeffrey Epstein and Israel.
In the primary Gallrein received from Paul Singer via MAGA KY $3 million. Singer is a major pro-Israel financier who helped fund the operation against Massie, and he is mentioned in Epstein records. His oil company CITGO was a major beneficiary of the Venezuela operation.
Miriam Adelson a joint citizen of US and Israel gave $750,000 to MAGA KY. Both Miriam and her late husband Sheldon Adelson are mentioned in Epstein-related materials.
Hedge Funder John Paulson was a major $410,000 Gallrein doner in primary. Massie publicly challenged Paulson’s appearance in Epstein’s address book, and subsequently released records that show Epstein emailed Paulson about a $50,000 donation to a dinner honoring Howard Lutnick.
Trump Secretary of Commerce Howard Lutnick contributed approximately $8.75 million to MAGA Inc. during the 2024 cycle. ABC News subsequently reported his acknowledgment of a 2012 visit to Epstein’s island, years after the point at which he had previously said he would never again be in Epstein’s presence.
Ronald Lauder gave MAGA Inc. $5 million, according to Forbes’ review of federal filings. Bloomberg reported that Epstein coordinated a legal entity allowing Lauder and Apollo co-founder Leon Black to share ownership of a $25 million painting. That was a specific financial arrangement involving Epstein.
Schwarzman, Blackstone’s co-founder, contributed $400,000 appears in the Epstein records.
The survivors deserve an accounting of who enabled Epstein, how institutions failed them, and why accountability took so long. Kentuckians deserve a representative prepared to demand those answers even when influential people would prefer silence.
Melissa Strange has committed herself to Epstein disclosure and accountability. On that basis, she has my endorsement for Congress.
Chris Tobe is the Chair of Kentucky Epstein Justice
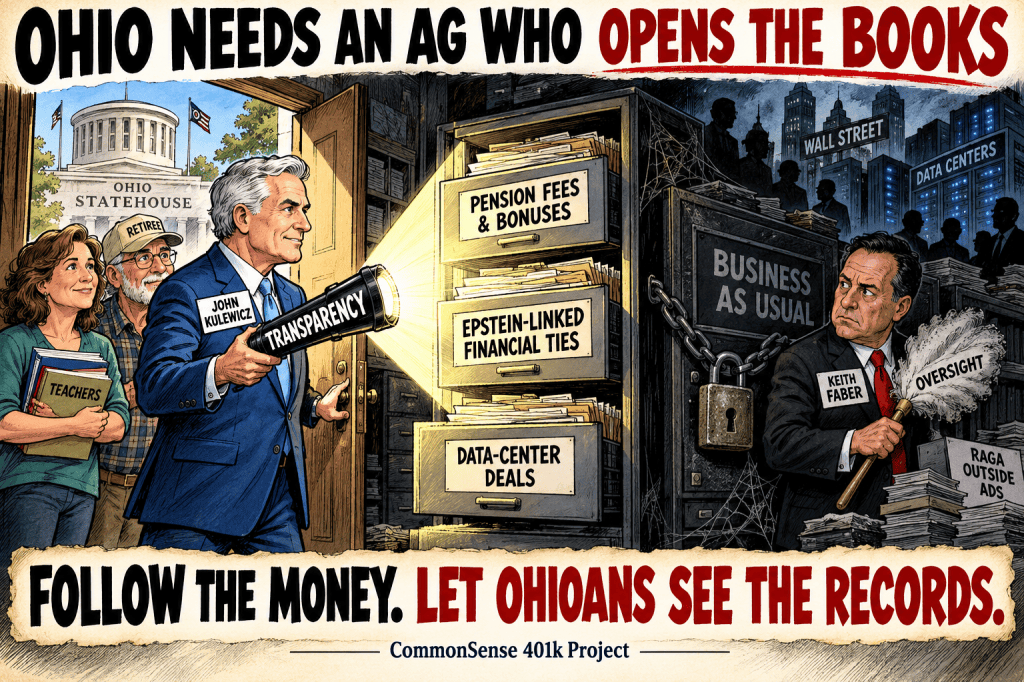
Ohio needs an attorney general willing to investigate the financial establishment that has grown comfortable operating behind pension secrecy, political connections and public subsidies. That is why I support John Kulewicz over Keith Faber.
Kulewicz offers an opportunity to change direction. Faber’s record as auditor gives me little confidence that he would deliver the independent scrutiny Ohio teachers, retirees and taxpayers deserve. Faber has taken large amounts of money from Epstein and data center-related donors.
The next attorney general should bring transparency to three overlapping subjects: public-pension investments, financial relationships involving Jeffrey Epstein’s wealthy associates, and the money behind Ohio’s data-center boom. Each involves powerful interests. Each requires someone willing to follow public money wherever the records lead. The AG plays a major role as Ohio STRS legal advisor.
Faber’s STRS audit was a whitewash in its practical effect
In December 2022, Faber announced that his special audit of the State Teachers Retirement System of Ohio found no evidence of fraud, illegal acts or data manipulation within its limited review. His office broadly reassured the public about the system’s controls and oversight.
I regard that as a whitewash in its practical effect: reassurance for the institution, insufficient accountability for the people paying its bills.
Faber did vaguely discuss investment fees, benchmarks, bonuses and secrecy. He weakly suggested reconsidering bonus arrangements and removing trade-secret protections. He did no real analysis that would lead to any real accountability or transparency a victory for the Epstein class.
Teachers needed a clear accounting of every layer of investment expense, a rigorous test of compensation against independently measured performance, and public access to the contracts governing their retirement money. They deserved more than recommendations that other officials debate whether the system should improve.
The scale is visible even in STRS’s own financial reporting. For fiscal 2023, STRS reported approximately $256 million in external asset-management fees, including approximately $181 million for alternative investments. Its notes explain that carried interest and certain other fund expenses appear within investment appreciation rather than that management-fee total. The headline fee number therefore does not tell the whole cost story. Faber helped enable and hide hundreds of other $millions in fees to Epstein-linked firms like Apollo and others.
An aggressive watchdog would make that distinction understandable to every teacher.
Yost pursued the reformers. Who investigates the establishment?
Under Republican Attorney General Dave Yost, Ohio pursued the removal of transparency advocates Wade Steen and Rudy Fichtenbaum over their dealings with a non-existent firm QED who receive $0 while ignoring hundreds of millions of hidden investment fees in secret no-bid contracts to Epstein linked firms like Apollo.
The corrupt AG Yost backed by corrupt Auditor Faber focused on a $0 issue while looking the other way at millions in excessive bonuses and hundred in excessive fees to Epstein class Wall Street firms.
Pension staff Compensation
Faber whitewashed the excessive compensation for public employees at the Ohio State Teachers Retirement Systems.
4 employees earned over $600,000.
20 employees earned over $400,000.
49 employees earned over $300,000.
85 employees earned over $200,000
STRSsalaries2024.csv
By comparison, the average Ohio teacher earns $68,000, with many retirees living on less than $45,000 per year — without a COLA.
A researcher from the conservative Heritage Foundation even found this excessive.
Epstein scrutiny must extend to pension relationships
Ohio’s Epstein discussion cannot stop with Les Wexner. Signal reported that Les Wexner directly gave Faber $15,000 in 2025.
Faber has received money from major Epstein banker JP Morgan.
My reporting has repeatedly raised questions about Apollo, its former leader Leon Black and Ohio public-pension business.
The Republican Attorney General’s Association RAGA is actively supporting Faber hrough Safer Ohio Fund, and its funding includes major banks and and a number of Apollo-controlled business (U.of Phoenix, ADT).
RAGA is actively supporting Faber through Safer Ohio Fund and they are well funded by Data Centers in the Millions.
Contributor
Combined receipts
Relationship to the issue
Dominion Energy
$1,100,000
Electricity supplier serving major data-center territory
Amazon.com Services
$305,000
Cloud/data-center operator
Google
$300,000
Cloud/data-center operator
Anthropic
$300,000
AI developer and computing customer
OpenAI
$225,000
AI developer and computing customer
Meta Platforms
$200,000
Data-center operator
Microsoft
$50,000
Cloud/data-center operator
Oracle
$50,000
Cloud/data-center operator
American Electric Power Service Corp.
$50,000
Electric utility
Vistra Corporate Services
$50,000
Power producer
Duke Energy
$25,000
Electric utility
Selected total
$2,655,000
The Center for Media and Democracy’s July investigation identified $250,000 each from Google, Anthropic and Dominion in the second quarter of 2026.
My August call for a data-center watchdog asked for something basic: identify the owners, disclose the public assistance, compare promises with results and determine who bears the risk.
Public pensions may also invest through managers active in digital infrastructure. That overlap requires a look through the investment structures; it does not prove that a particular pension dollar financed a particular Ohio facility.
The next attorney general should coordinate lawful investigations with auditors and regulators, scrutinize conflicts and misrepresentations, and pursue recovery where the evidence and law support it. Ohio also needs a searchable public record of these deals and legislation closing unjustified disclosure gaps.
Support Kulewicz—and demand a reform agenda
Kulewicz explicitly campaigns on confronting corrupt politicians and restoring transparency and accountability. His decades of litigation experience give him a credible foundation for that work.
I am endorsing him as the better opportunity for change, while asking him to make that promise concrete: independent pension-performance review; full investment-cost disclosure; scrutiny of compensation and consultant conflicts; examination of Epstein-linked financial relationships; and coordinated accountability for publicly supported data-center deals.
Ohio has had enough institutional reassurance. Teachers and taxpayers deserve answers about who receives their money, who benefits from secrecy and who is responsible when the public gets a bad deal.
John Kulewicz should be Ohio’s next attorney general. Then Ohioans should hold him to the standard Faber has failed to meet: follow the money, open the records and serve the public—even when the questions make powerful people uncomfortable.
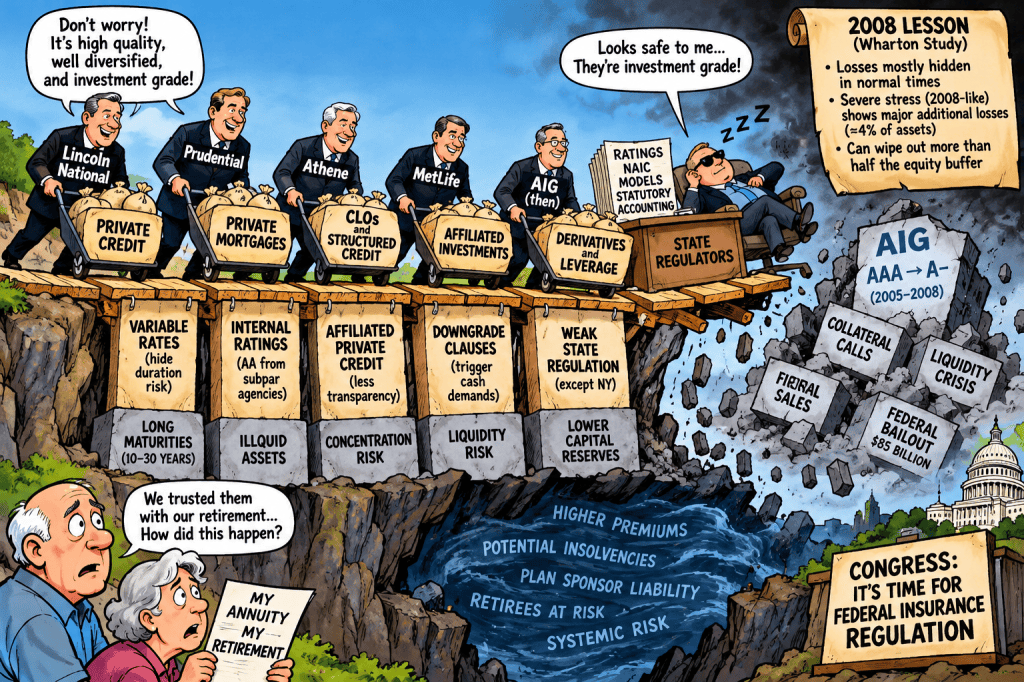
A major new Wharton study documents how private-equity-owned insurers favor affiliated investments, pay higher prices, delay recognizing losses, and expose policyholders to greater risks. The danger does not stop with private equity. Traditional insurers must compete with this model, potentially pushing the entire industry toward riskier investments. Congress needs a federal insurance regulator before the next insurance crisis.
By Christopher B. Tobe, CFA, CAIA The CommonSense 401k Project | October 2026
Wharton Has Done What Insurance Regulators Should Have Done Years Ago
A remarkable new 2026 paper from the Wharton School at the University of Pennsylvania provides some of the strongest empirical evidence yet that private-equity ownership is changing the risks borne by American annuity holders.
The paper, “Buying from the Family: Private Equity-Owned Insurers and Their Affiliated Investments,” by Amy W. Huber, Stefan Huber, Bella Shan, and Christina Zhu, examines what happens when the same financial conglomerate controls both an insurance company and the businesses originating the investments that insurer purchases.
The findings should alarm retirement-plan fiduciaries, pensioners, insurance regulators, and members of Congress.
The researchers used detailed statutory insurance filings, security-level transaction records, ownership structures, independent valuations, and NAIC stress tests. They did not merely speculate about conflicts of interest. They examined how affiliated transactions actually differ from arm’s-length investments.
Their findings challenge the comforting insurance-industry narrative that investment-grade ratings, state regulation, and statutory reserves adequately protect annuity holders.
The evidence suggests something much more troubling: insurance companies can become captive financing vehicles for the investment businesses of their owners, while policyholders bear the consequences.
And there is an even bigger problem that deserves attention.
Once private-equity-owned insurers gain a competitive advantage from investing in higher-yielding, less-transparent private assets, what happens to traditional insurers that must compete against them?
They face pressure to follow.
That is how a problem concentrated in private-equity-owned insurance companies can become an industry-wide threat.
The Wharton Findings: Follow the Policyholders’ Money
The numbers are extraordinary.
<text></text>
Wharton finding
Result
Assets of directly PE-owned insurers in 2024
$696 billion
Share of new PE-owned insurer investments going into structured securities
Over 40%
Share of those structured-security acquisitions issued by affiliates in 2024
Over 60%
Price premium on affiliated private securities in estimated primary-market transactions
47 basis points
Additional modeled capital loss in a 2008-like stress scenario
Approximately 4 percentage points
Average equity buffer relative to fixed-income portfolios
7.6%
Source: Huber, Huber, Shan and Zhu, September 2026, pp. 1–5, 20 and 27–28.
The authors find that directly PE-owned insurers allocate approximately twice as much of their new investment capital to structured securities as independent insurers.
More importantly, the majority of those structured-security purchases are issued by companies affiliated with the same private-equity owner.
This is not simply an insurer purchasing a diversified collection of independently originated investments.
It is a financial organization originating investments and then using an insurance company under common ownership to help finance them.
The traditional discipline of independent buyers negotiating prices, rejecting unattractive investments, and selling deteriorating assets can be weakened when the buyer and seller ultimately answer to the same financial conglomerate.
Wharton finds affiliated insurers pay more for the same investments
One of the study’s most revealing findings concerns pricing.
When comparing purchases of the same security on the same day, the researchers find that PE-owned insurers pay higher prices when buying from affiliated issuers.
For privately placed securities classified as primary-market transactions, the estimated premium is approximately 47 basis points of par value.
That is an especially powerful finding because the comparison controls for the security and transaction date.
The higher price benefits the affiliated issuer receiving financing.
But who bears the economic cost of the insurer paying more?
The insurance company does, and ultimately its financial strength supports the promises made to policyholders.
Wharton finds insurers are less willing to recognize deterioration in affiliated investments
The second finding is potentially even more troubling.
When affiliated investments fall below their historical cost, PE-owned insurers are less likely to recognize impairments and less inclined to sell those positions than their other investment holdings.
The researchers find that PE ownership offsets approximately 80% of the increased same-year impairment propensity otherwise associated with affiliated holdings.
This raises a basic question.
Is the insurer making investment decisions for policyholders, or is it protecting the financing needs and reported performance of affiliated investment businesses?
This pattern is consistent with affiliated insurers providing financial support when an independent investor might recognize a loss or exit.
And the researchers do not find that this favorable treatment is rewarded with superior investment performance.
Securities attracting greater affiliated PE-owned insurer investment have lower independent fair-value estimates beginning two years after purchase.
The supposed advantages of affiliated investing are not producing better results in the study’s comparisons.
The Most Frightening Number: Four Percentage Points of Additional Capital Loss
Wharton’s stress-test analysis should attract particular attention from insurance regulators.
Using NAIC CLO stress-test results and extending the findings to the broader structured-security portfolios of PE-owned insurers, the researchers estimate approximately four percentage points of additional portfolio losses under a severe financial-crisis scenario.
That compares with an average equity buffer equal to 7.6% of fixed-income investments.
In other words, the estimated additional losses alone could consume more than half that measured equity buffer.
The estimate extrapolates from stress-tested broadly syndicated CLOs to other structured securities whose stress performance cannot be directly observed.
But that limitation actually exposes another regulatory weakness: many of the private securities that deserve the closest examination are precisely those for which independent market prices and comparable stress data are most difficult to obtain.
If regulators cannot reliably measure the risk of the assets, why should policyholders accept assurances that statutory capital is adequate?
The Next Domino: Traditional Insurers May Be Forced to Take More Risk
Here is where I would take the Wharton findings a step further.
The paper concentrates on insurers directly owned by private-equity firms.
But competition does not stop at corporate ownership boundaries.
Imagine two insurers competing for the same $1 billion pension risk transfer.
One insurer benefits from an affiliated private-credit origination business. It can purchase complex, higher-yielding private securities and potentially benefit from favorable regulatory capital treatment.
The second insurer operates more traditionally, relying more heavily on liquid, publicly traded investment-grade bonds.
If the first insurer can generate higher expected portfolio yields, it may be able to offer the pension sponsor a lower premium while still targeting an attractive profit margin.
What does the second insurer do?
It can lose business, accept lower profits, or move toward investments offering higher yields.
This is the competitive contagion that could transform a private-equity insurance problem into an entire insurance-industry problem.
Traditional insurers do not have to be purchased by Apollo, Blackstone, KKR, or another private-equity manager to adopt similar investment strategies.
They can increase allocations to privately originated loans, commercial mortgages, structured credit, asset-backed securities, fund-finance arrangements, and privately rated investments.
They can hire private-credit managers or establish investment partnerships without changing the insurer’s ultimate ownership.
The incentive is straightforward: if higher portfolio yields permit lower PRT bids, more competitive annuity crediting rates, or larger retained investment spreads, competitors will feel pressure to participate.
Not every insurer will respond by taking more risk. Stronger capital standards, conservative management, and independent investment governance can resist that pressure.
But absent meaningful regulatory discipline, competition can reward the companies most willing to stretch their balance sheets.
That is a classic race-to-the-bottom problem.
And unlike ordinary corporate competition, the potential losers include pensioners who may depend on one insurance company’s promise for the rest of their lives.
Private Credit Can Look Short-Term on Paper While Remaining Illiquid for 15 Years
Another major concern is the way insurers measure asset/liability risk.
A privately originated commercial mortgage may have a contractual maturity of 15 years but reset its interest rate every three months.
Because of the floating rate, the asset can exhibit relatively low sensitivity to changes in benchmark interest rates.
But that does not mean the mortgage is liquid.
It does not mean the borrower can repay principal tomorrow.
It does not mean the insurer can sell the mortgage at book value during a financial crisis.
And it certainly does not mean that a private AA rating guarantees the existence of an active secondary market.
A three-month interest-rate reset does not turn a 15-year private mortgage into a three-month investment.
Yet the industry’s emphasis on interest-rate duration, ratings, and book-value accounting can obscure the distinction between interest-rate risk, credit risk, and liquidity risk.
An insurer can appear to have reasonably matched assets and liabilities while holding assets that cannot be converted into cash without substantial discounts.
The risk becomes especially serious when a policyholder, retirement plan, or regulator needs cash precisely because the insurer’s creditworthiness has deteriorated.
The Wharton paper reinforces this concern by finding that PE-owned insurers concentrate affiliated investments in securities that independent investors find more difficult to value.
It also identifies structures such as rated feeder funds and special-purpose vehicles that can transform private-fund exposure into securities receiving favorable regulatory capital treatment.
The question for Congress is simple:
Are regulatory ratings and capital formulas measuring the actual economic risks, or are financial engineers designing investments to satisfy the formulas?
Lincoln Shows Why This Is Not Just a Private Equity Problem
Lincoln reported approximately 96.8% investment-grade assets, while also disclosing substantial allocations to private credit, structured investments, and mortgages.
I compared Lincoln National’s five-year credit-default-swap spread of approximately 130 basis points in mid-September with Prudential’s approximately 80 basis points.
These are holding-company CDS quotations, not direct measures of the credit risk of the annuity-issuing subsidiaries. Nevertheless, they provide a market-based signal that deserves attention alongside statutory capital and insurer financial-strength ratings.
My criticism was not that Lincoln was insolvent (yet) but that its current ratings were somewhat contradicted by its higher credit default swap rates..
It was that calling an investment portfolio high quality does not adequately disclose the economic risk borne by a retirement plan holding a general-account fixed annuity.
The Wharton findings strengthen that concern.
Insurers should not be able to rely on favorable ratings and regulatory carrying values while withholding the information necessary to evaluate private-credit liquidity, asset maturity, valuation uncertainty, and stressed losses.
And the competitive pressure from PE-owned insurers may encourage even traditional carriers to increase those exposures.
Pension Risk Transfers: One Insurer Replaces a Diversified Pension Plan
The implications for pension risk transfers are particularly serious.
When a traditional defined-benefit pension plan purchases a group annuity to settle pension obligations, retirees move from a federally regulated pension arrangement into an insurance contract.
The transaction can remove PBGC protection and ERISA plan-level fiduciary oversight of the transferred benefits.
The insurer becomes the entity responsible for paying benefits, often for decades.
The Wharton paper adds another reason why those questions matter.
What happens when the insurer receiving pension liabilities is part of a financial conglomerate that also originates and structures the assets purchased with policyholder-backed capital?
What happens when the insurer favors affiliated investments, pays more for them, and is reluctant to recognize deterioration?
And what happens when a traditional insurer competes for the same pension liabilities by increasing its own private-credit allocation?
The danger is not limited to whether the insurer can pay this year’s benefits.
A PRT annuity may require payments for 20, 30, or 40 years.
Fiduciaries should therefore evaluate the insurer’s ability to meet obligations through future credit cycles, not merely its current financial-strength rating.
The Diversification Lie: Thousands of Investments, One Insurance Promise
A general-account insurer may own thousands of bonds, mortgages, and private loans.
But a 401(k) participant invested in its fixed annuity generally does not own those investments.
The participant owns a contractual claim dependent on one insurer’s ability to pay.
The insurer may be diversified internally, but the participant remains exposed to a single insurance company.
That is why I favor enforceable downgrade provisions permitting retirement plans to exit at book value when an insurer’s financial strength deteriorates.
A downgrade clause could allow a plan to transfer its money to another financially sound insurer before severe deterioration makes withdrawal difficult.
The absence of such protections can leave participants captive to the very insurer whose creditworthiness has become questionable.
The Wharton findings make these contractual protections more important, not less.
If insurers hold growing concentrations of illiquid private assets, fiduciaries must understand how they will exit when those assets are hardest to sell.
A downgrade clause is not a substitute for adequate capital or regulation. It is an additional protection that should be evaluated, priced, and disclosed.
Weak State Regulation Is Enabling a National Problem
The United States regulates insurance primarily through state governments.
The NAIC coordinates standards, but it is not a national insurance regulator with independent authority to enforce every model rule.
Meanwhile, the largest insurance and asset-management conglomerates operate nationally and internationally.
Their investment structures can involve Delaware insurers, Iowa-regulated entities, Bermuda reinsurers, Cayman Islands investment vehicles, Luxembourg funds, and affiliated asset managers.
The same principle should apply to annuity insurers.
If an insurer invests through a Bermuda or Cayman structure, federal regulators should be able to trace the investment to its underlying economic exposure.
If an insurer purchases securities originated by an affiliate, regulators should be able to determine whether the transaction occurred at arm’s length.
If an investment receives an AA rating from a smaller rating agency, regulators should be able to examine the methodology, conflicts, underlying collateral, and actual trading evidence.
And if an insurer transfers liabilities to an offshore reinsurer, federal regulators should be able to evaluate the entire transaction, including the assets and capital supporting the obligations.
Financial conglomerates operate across state and national borders. Regulatory accountability should not stop at those borders.
CRS reported approximately $849 billion in private-credit holdings among life insurers in 2024 and identified concerns involving private ratings, affiliated investments, offshore reinsurance, and regulatory arbitrage.
Those numbers are not limited to directly PE-owned insurers.
The Wharton paper now provides additional evidence of why these issues deserve federal attention.
State regulators are supervising companies whose investment decisions can affect national retirement markets and potentially transmit losses into broader credit markets.
The authors explicitly identify the possibility that losses on affiliated investments could force insurers to sell other securities to restore capital, spreading stress beyond the original private-credit investments.
That is systemic risk.
It cannot be adequately addressed merely by reviewing whether each individual insurer satisfied its state’s statutory capital formula at year-end.
The financial system is interconnected. The regulatory response must recognize those connections.
Elizabeth Warren Is Asking Questions Congress Should Have Asked Years Ago
Senator Warren’s scrutiny of private-equity-linked insurers reflects a larger issue that should concern both political parties.
Americans depend on annuity contracts for retirement security.
Those promises should not depend on whether a small state insurance department has sufficient resources, independence, or expertise to examine a global private-credit conglomerate.
Congress should establish a national insurance regulator with genuine investigative, supervisory, and enforcement authority.
A CFPB-style model would put the interests of policyholders at the center, but the agency would also need powers the current CFPB does not possess: prudential supervision, capital and liquidity examinations, and oversight of insurance holding-company groups.
The goal should not be to replace every state insurance function.
It should be to establish enforceable national protections against risks that state-by-state regulation cannot adequately control.
Seven Federal Reforms Congress Should Enact
1. Require full transparency of private-credit and affiliated investments.
Large insurers should disclose private-credit exposures, affiliated transactions, underlying asset classes, valuation methods, ratings providers, contractual maturities, and liquidity characteristics in standardized, comparable formats.
2. Require independent valuations of affiliated investments.
Affiliated assets should receive independent valuation scrutiny, especially when they are privately placed, difficult to trade, or purchased from related entities. Regulators should compare carrying values with credible market-based exit values.
3. Establish meaningful federal capital standards for private-credit risk.
Regulatory capital should reflect credit risk, concentration, valuation uncertainty, and liquidity. A privately rated AA security should not automatically receive favorable treatment when its underlying risk cannot be independently verified.
4. Require separate disclosure of interest-rate duration, credit-spread duration, and contractual maturity.
Insurers should not be permitted to use short floating-rate reset periods as a substitute for disclosing long-term principal exposure.
A 15-year private mortgage with a quarterly reset should be reported as exactly that.
5. Conduct federal systemic liquidity stress tests.
Regulators should test what happens when multiple insurers simultaneously experience private-credit losses, rating downgrades, reduced new premiums, and demands for cash.
The stress tests should include the possibility that several insurers attempt to sell similar illiquid assets at the same time.
6. Strengthen retirement-annuity protections.
For ERISA fixed annuities and PRT contracts, Congress should require clear disclosure of insurer credit and liquidity risks, meaningful comparisons among insurers, and competitive evaluation of enforceable downgrade protections.
For PRTs, fiduciaries should obtain competitive bids that explicitly price additional credit protections rather than assume such protections are unavailable.
7. Establish a federal insurance regulator with authority over entire financial groups.
A federal watchdog must be able to examine insurers, affiliated asset managers, reinsurers, and investment structures across state and offshore jurisdictions.
It must also have the authority to intervene before liquidity problems become insolvencies.
Disclosure without enforcement is not enough.
The Entire Industry Is Being Pulled Toward Greater Risk
The Wharton authors deserve enormous credit for bringing hard evidence to a debate too often dominated by insurance-company marketing and reassuring credit ratings.
Their research demonstrates that PE-owned insurers systematically behave differently when investing in affiliated securities.
They buy more structured credit, concentrate purchases among affiliates, pay higher prices in certain transactions, and are less inclined to recognize or exit deteriorating affiliated investments.
Their stress analysis indicates that the resulting downside exposure could be substantial relative to insurer capital.
But the greatest long-term danger may be what happens outside private equity.
When some insurers generate higher investment yields by accepting greater private-credit complexity, opacity, and illiquidity, competitors face pressure to do the same.
Traditional insurers may increasingly adopt the same investment strategies even without being acquired by private-equity firms.
The result could be an industry in which higher private-credit exposure becomes the competitive norm.
This is precisely why relying on state regulators, private credit ratings, and year-end statutory accounting is insufficient.
The financial crisis will not wait for regulators to discover that a portfolio with a short reported interest-rate duration contains 15-year loans that cannot be sold.
And retirees should not have to discover that their supposedly safe annuity is backed by investments whose risks were poorly measured, privately rated, or hidden inside affiliated structures.
The Wharton paper should become required reading for Congress, the NAIC, state insurance commissioners, pension fiduciaries, and every retirement consultant recommending annuities.
It provides evidence that the existing system deserves far more scrutiny.
Congress must now confront the broader question: If competition is pushing the entire annuity industry toward increasingly opaque and illiquid private credit, who is protecting the retirees who ultimately bear the risk?
The answer cannot remain 50 state insurance departments acting separately.
America needs federal insurance regulation, transparent private-credit accounting, credible systemic stress testing, and enforceable protections for annuity holders — before the next insurance crisis, not after.
APPENDIX
Remember AIG: A Highly Rated Insurance Giant Needed an $85 Billion Rescue
The Wharton study’s 2008-style stress test should remind Congress of something the insurance industry would prefer to forget: AIG.
In early 2005, AIG held an AAA credit rating from Standard & Poor’s. By September 2008, after successive downgrades, it was rated A− and required an emergency $85 billion Federal Reserve rescue to avert a potentially catastrophic failure.
AIG did not have to be rated junk before its liquidity crisis became overwhelming.
Its problems involved deteriorating mortgage-related securities, derivatives collateral calls, securities lending, and an inability to raise cash when counterparties lost confidence.
On September 15, 2008, rating downgrades generated more than $20 billion of additional collateral and termination-payment requirements over a short period.
The federal government intervened the next day.
Now consider what the Wharton researchers have found about today’s private-equity-owned insurers.
Their analysis of NAIC stress tests shows that additional losses associated with affiliated investments are largely invisible in moderate scenarios but become substantial under financial-crisis conditions.
Their estimated additional portfolio loss of approximately four percentage points would consume more than half the measured equity buffer of the PE-owned insurers in their sample.
And those losses are additional to the baseline stress losses.
The study does not predict another AIG. It documents a potential source of severe downside exposure that deserves much more scrutiny.
AIG demonstrated how rapidly investment losses, ratings downgrades, collateral requirements, and disappearing liquidity can interact.
Wharton demonstrates that today’s affiliated private-credit investments may contain risks that become visible only under severe stress.
Congress should not wait until another highly rated insurance conglomerate needs emergency federal support to discover that state regulation, favorable ratings, and statutory accounting failed to capture the full risk.
The lesson of 2008 is not that every insurer will fail. It is that even a large, highly rated financial institution can become a systemic threat when opaque credit exposures and liquidity obligations interact.
America needs federal insurance stress testing that measures not only investment losses, but also the cash insurers must produce when confidence disappears.
“Do not put all your eggs in the same basket,” or diversification, is one of the most important investment principles. Many annuities used in retirement plans such as fixed, index, and lifetime annuities in 401k type plans, have single-entity credit and liquidity risk. Many plans avoid annuities, but for those who do the risk could be mitigated by downgrade clauses or purchasing credit default swaps.
Harry Markowitz’s landmark 1952 paper, “Portfolio Selection,” established the foundation of modern portfolio theory: portfolio risk depends on how investments move together, as well as the risks of individual holdings. Combining investments with imperfectly correlated returns can reduce portfolio risk. Merely accumulating more securities offers less protection when they share the same underlying vulnerabilities. traders.berkeley.edu
ERISA §404(a)(1)(C) requires fiduciaries to diversify plan investments to minimize the risk of large losses, unless circumstances make foregoing diversification clearly prudent.
For fixed income investors, that principle has a practical application: spread exposure across independent issuers so that one company’s financial trouble cannot devastate the portfolio.
An annuity issued by a single insurer can concentrate participants’ retirement savings in one company’s ability to honor its promises. Executive Life’s failure and AIG’s need for an extraordinary federal rescue demonstrate why an insurance guarantee cannot substitute for evaluating credit and liquidity risk. Insurer distress could expose participants to payment delays, withdrawal restrictions, and/or losses. Plan fiduciaries who fail to prudently evaluate and monitor that concentration, assess exit rights, and document the justification for accepting the risk can increase their exposure to ERISA liability for resulting losses.
A downgrade clause would give a retirement plan a practical way to reduce single-insurer risk when the insurer’s financial strength deteriorates. For example, a plan could require an insurer to meet a specified AA financial-strength rating at purchase, with an enforceable right to withdraw the full contract value—including accrued interest—if its rating falls to A. The plan could then transfer the proceeds to another insurer meeting its AA standard, following appropriate due diligence. The principle is straightforward: participants should not become captive creditors of a weakening insurer because leaving would trigger a financial penalty. Downgrade clauses are not regularly offered in annuities because they are lest profitable to the insurer. The difference in costs or yield so annuities with and without downgrade clauses could be used as a way to measure risk related damages.
Credit default swaps offer another potential way to reduce an annuity’s single-insurer credit risk. A $100 million Lincoln fixed-annuity allocation illustrates why single-insurer risk should receive a dollar valuation. Applying the historical 97.8-basis-point Lincoln CDS spread reported for September 2025 produces an annual credit-protection cost equivalent of $978,000—approximately $4.89 million over five years before adjustments. That figure is a starting point for valuing the exposure participants bear. A damages estimate would refine it for the actual annuity issuer and contract, subtract the residual risk of the prudent alternative, and credit any additional compensation participants received. The absence of an insurer failure does not make the exposure economically worthless; it means the analysis must value the contractual risk rather than simply count unpaid benefits.
No one in Kentucky’s current election cycle has received more donations from the Epstein class.
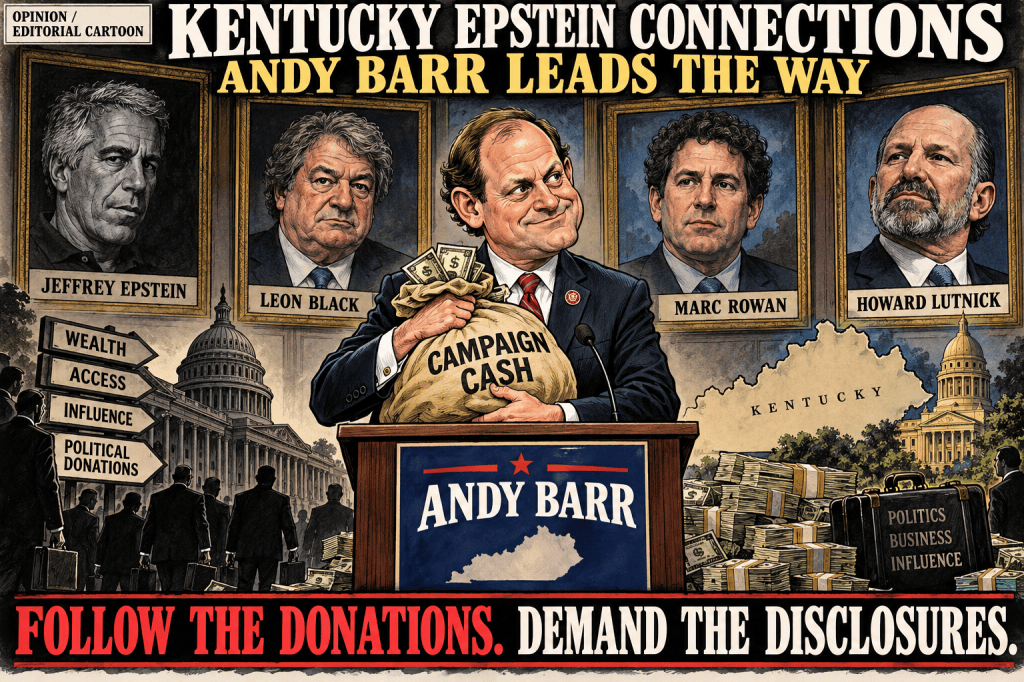
There is no more serious connection to Epstein than Apollo and its founder/CEO Leon Black. From his conviction in 2008 to his death in 2019 Leon Black provided Epstein with over $158 million for “tax advice”, despite Epstein having no qualifications in that area. There are over 8000 mentions of Black in the Epstein Files. Current Apollo CEO Marc Rowan is also prominently featured in the Epstein files. Barr has accepted at least $37,500 from Apollo in 2025-26.
Howard Lutnick of Cantor Fitzgerald current Commerce Secretary, and Epstein neighbor sons and firm gave $8,500 to Barr. Lutnick lied about visiting Epstein Island in 2012 claiming he cut ties in 2005.
Stephen Schwatzman of Blackstone has only 179 mentions in the Epstein file. Blackstone has given Barr over $83 thousand.
Jes Daly of JP Morgan, which has given Barr over $25 thousand had extensive relationship with Jeffrey Epstein.
Andy Barr will be a proud protector of the Epstein class and the receipts prove it.
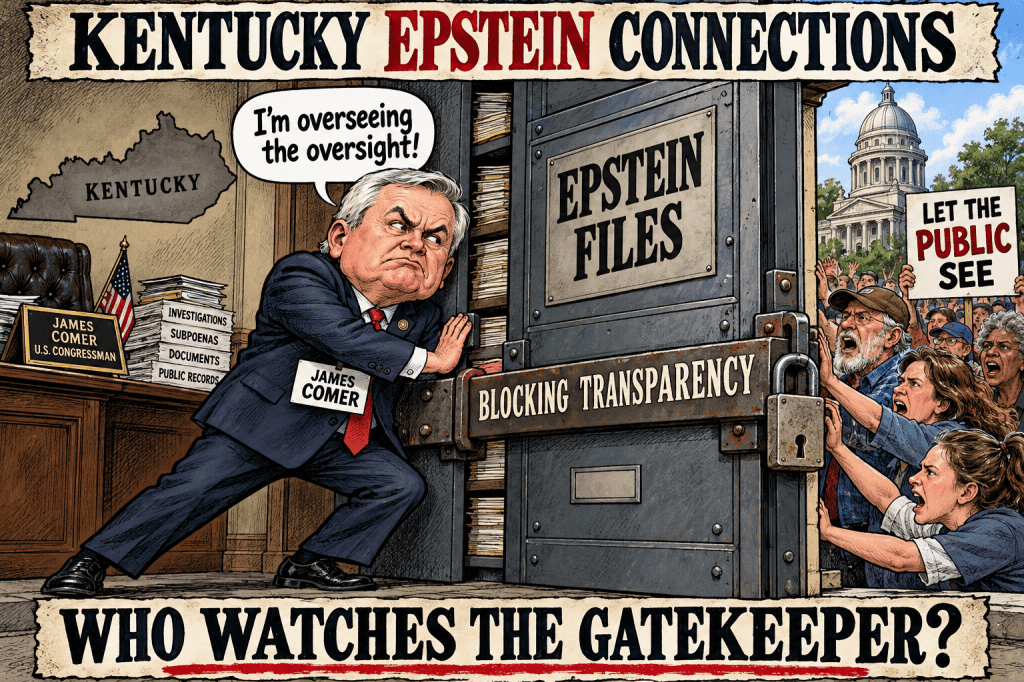
Comer should welcome every effective avenue for obtaining evidence. Instead, Comer publicly argued against the need for the very mechanism that ultimately helped produce the Epstein Files Transparency Act.
Comer eventually voted for that legislation when it passed the House 427–1 on November 18, 2025. That vote belongs in the record. It does not erase his earlier effort to persuade Americans that the pressure campaign was unnecessary.
A document dump is not the same as disclosure
Comer’s committee released more than 33,000 pages in September 2025. The number sounded impressive. But committee Democrats said approximately 97% of the material was already public. Louisville Public Media reported that the release largely contained information already known—and that the White House supported Comer’s process while fiercely attacking Massie’s effort.
When CNN confronted Comer with the 97% criticism, he pivoted to a comparison with Joe Biden and praised Trump’s cooperation.
That response exposed the political problem. Survivors needed an accounting of missing evidence. Comer offered a partisan comparison.
The proper measure of transparency is whether previously concealed evidence becomes available, whether withholding is justified and whether the public can determine what remains missing. Recycling thousands of pages cannot substitute for answering those questions.
Follow the money—after another delay
The financial records were central to understanding how Epstein operated.
On September 8, 2025, Comer’s committee promised to pursue additional bank records. On October 31, Khanna and other committee Democrats wrote to Comer pointing out that 53 days had passed without bank-record subpoenas being issued. Their letter demanded action and included a proposed document schedule covering financial transactions, communications and due diligence.
Comer subsequently subpoenaed JPMorgan Chase and Deutsche Bank on November 18. That was necessary investigative work. It also came more than two months after the committee publicly promised to pursue those records.
For anyone concerned about Wall Street’s role, that delay deserves scrutiny. Financial evidence should have been a priority from the outset.
The chairman repeatedly stepped into Trump’s defense
On August 18, 2025, Comer publicly praised the administration’s commitment to transparency as DOJ prepared to begin producing records.
On September 8, his official statement accused Democrats of politicizing the estate’s documents and emphasized that Trump was not accused of wrongdoing.
An investigator must distinguish evidence from insinuation. But the chairman’s job is to establish the facts wherever they lead. Repeatedly making the president’s political defense part of the committee’s message undermines confidence in that independence.
The committee’s own November release went further, describing testimony as having defeated Democrats’ allegations against Trump. The public-facing emphasis was unmistakable: protecting the president’s reputation had become part of the investigation’s presentation.
Massie and Khanna kept demanding enforcement
By January 2026, Massie and Khanna were asking a federal judge to appoint an independent monitor. They alleged missed deadlines, improper withholding and excessive redactions, alongside failures to protect survivors’ information.
In July, they introduced the Epstein Files Transparency Act II to provide additional avenues for challenging DOJ noncompliance in court.
Their persistence illustrates why assurances from committee leadership were inadequate. A transparency promise needs enforceable consequences.
Comer also took substantive steps that deserve acknowledgment. He subpoenaed banks and witnesses, issued a subpoena to Pam Bondi following a committee vote, and pursued Leon Black’s noncompliance. In September 2026, the House held Black in contempt after the committee unanimously recommended that action.
Those actions demonstrate that the committee possessed meaningful tools. They strengthen the case for demanding consistent, aggressive use of them.
The strongest case against Comer rests on his documented conduct: dismissing the need for the Massie–Khanna petition, defending the administration’s cooperation, delaying pursuit of banking evidence and repeatedly framing disclosures around Trump’s political defense.
Kentuckians should demand a public accounting of outstanding records, explanations for withheld material, equal treatment of witnesses and consequences for noncompliance.
Comer held the chairman’s gavel. He should be judged by how forcefully he used it to break secrecy—and by the occasions when he used his platform to tell Americans that the process they distrusted was working.
Kentucky Epstein Connections – Alvarado accuses Dembo, but has many of his own.
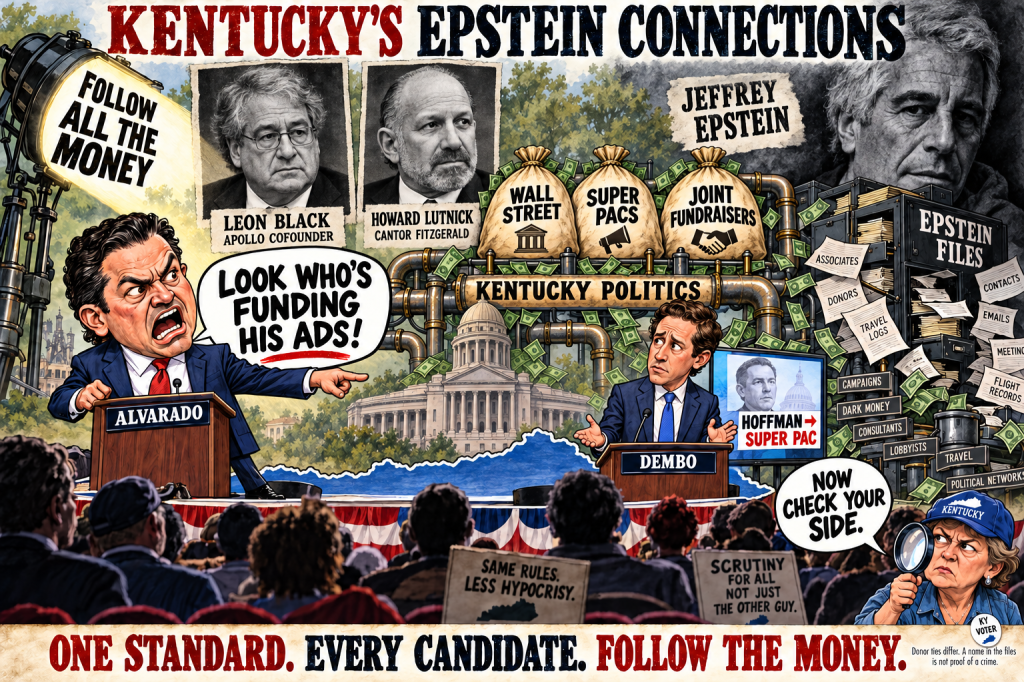
In the 6th District Congressional race Republican Ralph Alvarado accuses Democrat Zach Denbo of taking Epstein related donations from Reid Hoffman of LinkedIN. I applaud him for bringing out these facts. I think it is important to point out Alvarado’s far more serious Epstein ties.
There is no more serious connection to Epstein than Apollo and its founder/CEO Leon Black. From his conviction in 2008 to his death in 2019 Leon Black provided Epstein with over $158 million for “tax advice”, despite Epstein having no qualifications in that area. There are over 8000 mentions of Black in the Epstein Files. Current Apollo CEO Marc Rowan is also prominently featured in the Epstein files. Apollo owned Lifepoint Health gave a $10,000 donation to Alvarado.
Alvarado received substantial funding from the MAGA Inc. Superpac, whose donors include many Epstein buddies and those broadly in the Epstein Class. Howard Lutnick current Commerce Secretary, and Epstein neighbor gave MAGA Inc. $8.75mm and lied about visiting Epstein Island in 2012 claiming he cut ties in 2005. Ron Lauder a $5mm donor to MAGA Inc. who is best known for pushing Trumps “Greenland” initiative but files show that Epstein helped him establish an entity for him and Leon Black to jointly purchase a valuable painting which got 961 mentions in the Epstein files. . Stephen Schwatzman another $5mm MAGA donor has only 179 mentions in the Epstein file. Marc Rowan of Apollo gave $1mm to MAGA as well.
Documents show Epstein helped establish an entity through which Lauder and Black jointly acquired a valuable painting
As head of Kentucky Epstein Justice, I want to look at every congressional race the US Senate Race and the Louisville Mayor Race for Epstein related donations.
Jeffrey Epstein pal, billionaire Reid Hoffman gave $500K to the Dembo superPAC- almost half of the cash raised.
Hoffman once sent Epstein ice cream with a note that it was “for the girls”
So every time you see an ad meant to help Zach Dembo, it was probably paid for by the billionaire who sadistically sent ice cream to Jeffrey Epstein’s victims. Dembo wants power so bad he doesn’t care where the money came from.
This is dirty Epstein Class money fueling Zach Dembo’s campaign and it’s offensive that it’s taken this long for Kentucky to learn the truth.
In the 6th District Congressional race, Republican Ralph Alvarado accuses Democrat Zach Dembo of taking Epstein-related donations from Reid Hoffman of LinkedIn. I applaud him for bringing out these facts. I think it is important to point out Alvarado’s far more serious Epstein ties.
No one has a more serious connection to Epstein than Apollo and its founder/CEO, Leon Black. From his conviction in 2008 to his death in 2019 Leon Black provided Epstein with over $158 million for “tax advice”, despite Epstein having no qualifications in that area. The Epstein Files contain over 8,000 mentions of Black. Current Apollo CEO Marc Rowan is also prominently featured in the Epstein files. Apollo-owned Lifepoint Health gave a $10,000 donation to Alvarado.
Alvarado received substantial funding from the MAGA Inc. Super PAC, whose donors include many Epstein buddies and those broadly in the Epstein Class. Howard Lutnick, current Commerce Secretary and Epstein neighbor, gave MAGA Inc. $8.75mm and lied about visiting Epstein Island in 2012, claiming he cut ties in 2005. Ron Lauder a $5mm donor to MAGA Inc. who is best known for pushing Trumps “Greenland” initiative but files show that Epstein helped him establish an entity for him and Leon Black to jointly purchase a valuable painting which got 961 mentions in the Epstein files. Stephen Schwatzman of Blackstone, another $5mm MAGA donor, has only 179 mentions in the Epstein file. Marc Rowan of Apollo gave $1mm to MAGA as well.
*By Chris Tobe, CFA, CAIA | The CommonSense 401k Project*
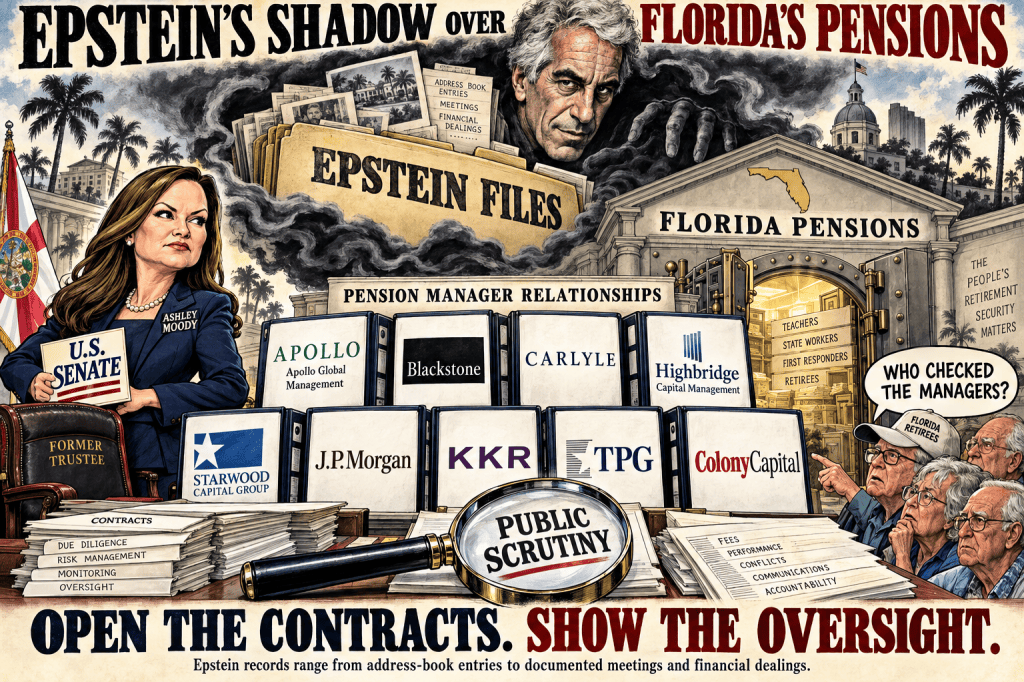
As Florida attorney general, Moody was one of just three trustees of the State Board of Administration, alongside the governor and chief financial officer. The Florida Retirement System Pension Plan held approximately $198 billion in June 2024, during her tenure. By June 2025, it held $211.5 billion.
New reporting from Drop Site News scrutinizes her office’s investigation into Jeffrey Epstein’s work-release arrangement and reports campaign contributions from people identified in Epstein-related records. The pension dimension makes the accountability question larger: some of the financial institutions connected to those records also had access to Florida workers’ retirement capital.
Apollo and Blackstone are the obvious starting points. They are not the end of the story.
Follow the pension relationships
The names extend to Carlyle cofounder David Rubenstein, Highbridge cofounder Glenn Dubin, Starwood founder Barry Sternlicht, former JPMorgan executive Jes Staley, JPMorgan asset and wealth management chief Mary Erdoes, KKR cofounder Henry Kravis, TPG cofounder David Bonderman, and Colony Capital founder Tom Barrack.
These connections differ. Some involve confirmed meetings, some extensive correspondence, some financial dealings, and some address-book entries.
The public deserves to know which managers received pension business, what trustees learned about their leadership, and how those facts affected investment oversight.
Carlyle: Rubenstein met Epstein after his conviction
David Rubenstein’s connection goes beyond a name appearing in somebody else’s conversation.
Released correspondence records a November 2012 meeting and an exchange afterward acknowledging it. Rubenstein’s spokesperson described a single, 20-minute meeting at Carlyle’s office about philanthropic proposals he did not pursue. The records also contain discussion of another possible meeting.
Florida’s pension report identifies Carlyle private equity, property, aviation and credit investments. One disclosed position alone—Carlyle Property Investors—was valued at approximately $363.4 million in June 2025.
A separate document, EFTA00665300, shows Boris Nikolic forwarding Epstein older fundraising correspondence headed “Materials at request of David Rubenstein.” It includes communications from Ryan Schwarz about a healthcare fund and its placement memorandum. That establishes that Carlyle-related materials reached Epstein through Nikolic.
The trustee question is straightforward: what did Florida examine about Carlyle’s leadership, controls and disclosures, and where is the written record?
Highbridge: Dubin adds a financial connection
Glenn Dubin cofounded Highbridge Capital Management. His relationship with Epstein involved both personal contact and financial dealings, including Epstein’s investments and reported involvement in Highbridge’s sale to JPMorgan.
Florida’s June 2025 report lists approximately $324.2 million in Highbridge Tactical Credit Fund and $25.6 million in Highbridge Convertible Dislocation Fund—roughly $349.8 million combined. Dubin left Highbridge in 2013.
Starwood: Sternlicht’s dinner was confirmed
Barry Sternlicht’s spokesperson confirmed that the Starwood founder attended an August 2018 dinner at Epstein’s Manhattan home—approximately a decade after Epstein’s conviction.
The spokesperson said Sternlicht attended at Peter Attia’s urging, wanted to meet Woody Allen and Kathryn Ruemmler, left early, and never subsequently saw or spoke to Epstein. A separate purported 2013 meeting was disputed.
Florida’s pension report lists several Starwood real estate funds.
JPMorgan: the governance issue has an established regulatory record
Jes Staley headed JPMorgan’s asset-management business from 2001 through 2009. Florida has a documented history of investing with JPMorgan, and its more recent report lists multiple JPMorgan property funds.
Staley’s Epstein relationship was extensive. The UK Upper Tribunal upheld his regulatory ban after he approved misleading statements about the nature and timing of that relationship.
That is a concrete finding about integrity in financial leadership. Pension trustees should care deeply about it.
Mary Erdoes also belongs in the examination. Reporting documents meetings with Epstein in 2011 and 2013. Other bankers identified in reporting include John Duffy and Justin Nelson. JPMorgan said the interactions involved ordinary client matters, litigation or client introductions, and denied knowledge of Epstein’s crimes.
Erdoes’s relevance to institutional investors is particularly direct because she leads asset and wealth management.
KKR, TPG and Colony broaden the inquiry
Henry Kravis appears in Epstein’s address book, according to William Cohan’s reporting. Florida reports investments in KKR Asian funds. That establishes an address-book overlap with the cofounder of a pension manager.
David Bonderman, TPG’s cofounder, appears in Epstein’s earlier address book, investigated by Business Insider. Florida reports TPG Growth fund holdings. Tom Barrack’s connection is more substantial. Released records document years of correspondence with Epstein after his conviction. Florida’s December 2016 schedule listed $375 million in commitments across three Colony distressed-credit funds. Its June 2024 schedule still reported approximately $44.9 million in combined remaining value in those funds.
California already demonstrated the danger of weak pension oversight
The CalPERS placement-agent scandal involved Apollo-managed investments, fraudulent disclosure letters and concealed financial relationships. Former CalPERS CEO Fred Buenrostro pleaded guilty and received a 54-month prison sentence. A Trustee committed suicide.
It is also highly likely that Florida used brokerage firm Cantor Fitzgerald owned by Howard Lutnick, but was not disclosed.
Ashley Moodys ties to the Epstein class disqualifies her for Senate.
Kentucky’s public pensions need a comprehensive investigation of excessive investment fees. They also need to make sure the investigation does not become another way for Wall Street to profit from pension secrecy. Especially putting this into the hands of Apollo with its extensive connections to Jeffrey Epstein.
I have publicly estimated that CERS and related pension plans administered by the Kentucky Public Pensions Authority are burdened with more than $200 million a year in excessive fees, primarily associated with private equity firms operating through secret, no-bid contracts.
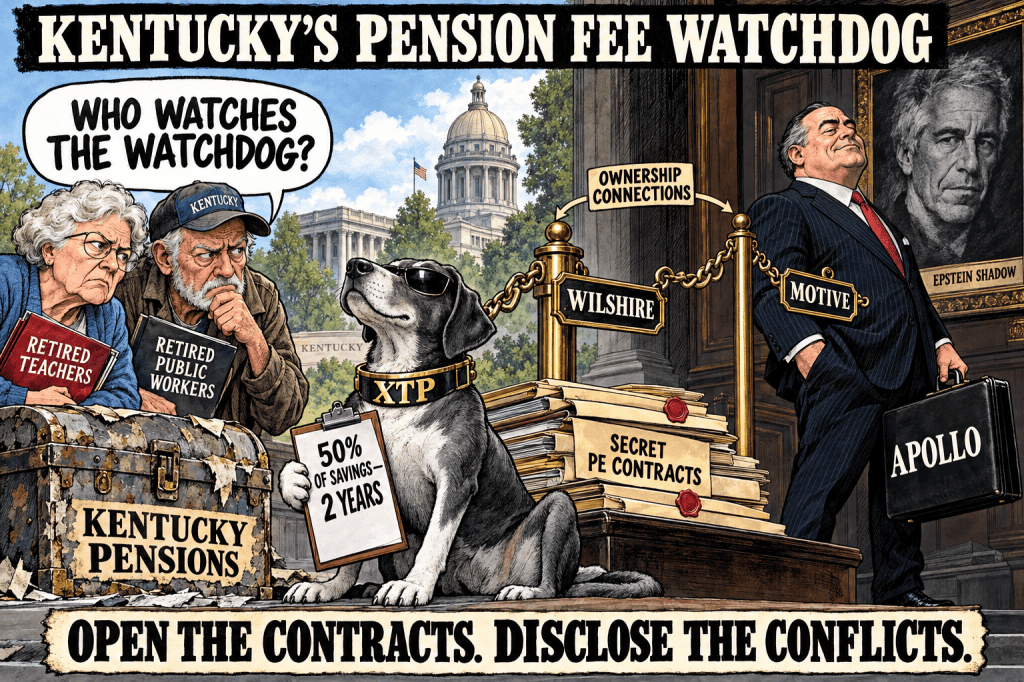
Now CERS has hired XTP Implementation Services to examine investment contracts and share in the savings.
Recovering pension money sounds attractive. But the ownership relationships behind the investigator raise an unavoidable question:
Could Kentucky’s fee investigation become a tool for selectively pressuring some private equity firms while protecting others?
The public deserves an answer before a savings announcement becomes an excuse to stop asking questions.
The 50% bounty is real
In his September 14, 2026, report to the CERS board, CEO Ed Owens announced that CERS had finalized its agreement with XTP. The assignment includes reviewing existing investment manager and contractual service agreements for compliance. CERS and XTP will split savings equally for the first two years; subsequent savings belong entirely to the trust.
That is a substantial financial incentive.
For illustration, $20 million in qualifying savings during the sharing period would mean $10 million for XTP. Whether that price is reasonable depends on the work performed, the alternatives available, and precisely how “savings” are calculated.
The board memorandum establishes a two-year sharing period. It does not establish that the bounty continues forever. Nor does that summary tell us whether there is a dollar cap, how recoveries are distinguished from future discounts, or who independently verifies the calculation.
Publish the executed contract. Kentucky should not need another secret agreement to investigate the costs of existing secret agreements.
Follow the ownership chain
Wilshire acquired XTP in August 2024. Wilshire itself was acquired by CC Capital and Motive Partners in January 2021. Later in 2021, Apollo announced a strategic partnership that included acquiring up to a 24.9% minority interest in Motive’s management company and investing through Motive-managed vehicles.
Gretchen Morgenson’s May 2026 reporting on the CalPERS investigation highlighted the Apollo–Motive–Wilshire connection. My accompanying CalPERS analysis examined the broader history of Apollo’s relationship with the pension fund.
Kentucky trustees should demand a current ownership chart, economic-interest disclosures, and an explanation of every party’s governance and information rights.
“Independent” should describe enforceable protections, not simply appear in the sales presentation.
Selective scrutiny could turn oversight into a competitive weapon
Consider how this arrangement could be misused.
An investigator examines one private equity manager aggressively, demands extensive documentation, challenges expense allocations and presses for concessions. Another manager receives a narrower review. A third is deferred.
Even when all contracts are nominally within scope, the depth, timing and consequences of scrutiny can differ dramatically.
If Apollo competitors received aggressive treatment while Apollo-related interests received favorable treatment, Kentucky’s pension oversight could become a competitive weapon.
A targeted firm might face pressure to make concessions while a connected competitor preserved its economics. A few visible savings could then provide political cover for leaving much larger costs untouched.
Who decides which fees deserve a fight?
A percentage-of-savings arrangement rewards recoveries that qualify for compensation. It does not automatically reward a complete accounting of every excessive cost.
An investigator could pursue easy discounts, avoid difficult managers, and produce a profitable engagement without confronting the largest problems.
A pension board could announce millions saved while leaving the basic system of secret contracts untouched.
The public therefore needs to see more than a total savings figure. It needs a manager-by-manager accounting of what was examined, what was challenged, what was recovered and what remains unresolved.
Every exclusion should have a written explanation. Every refusal to provide records should reach the trustees. Every material finding should survive the end of a negotiation.
A manager’s willingness to offer a discount must not buy silence about the underlying conduct.
A compliant contract can still be an outrageous bargain
CERS’s description emphasizes checking whether contracts are being followed. That is useful work. It is also an inadequate stopping point.
A private equity manager can follow an agreement perfectly while collecting excessive compensation under its terms.
If Kentucky agreed to an overpriced arrangement, confirming that the manager charged the agreed price does not establish that the price was prudent.
The review must distinguish among billing errors, unauthorized expenses, contractually permitted but excessive charges, and the total economic cost of the investment.
Otherwise, “the contract was followed” could become the latest defense of a terrible contract.
Pension data must stay out of competitors’ hands
XTP says it obtains detailed investment cost information, investigates contractual compliance and negotiates with service providers. Its website also claims that it has no conflicts because it works exclusively for asset owners.
That claim deserves scrutiny across the ownership structure.
An investigator could obtain information about competitors’ fee concessions, side letters, expense practices and negotiating positions. Those records can have substantial commercial value.
Kentucky should require explicit restrictions preventing identifiable manager information from reaching Apollo, other investment managers, or unauthorized affiliates and owners. Those restrictions should be independently tested.
Access to public pension contracts must never become a private intelligence service for a connected investment business.
Kentucky needs public rules and an independent referee
The legislature, trustees and state oversight officials should require:
Full disclosure of the XTP agreement, including compensation definitions, caps, exclusions, termination provisions and confidentiality terms.
A published review plan identifying covered managers, priorities and objective standards for scrutiny.
Independent examination of connected firms, including any Apollo or Wilshire-related relationships within the assignment.
Independent verification of savings, excluding automatic fee step-downs, reductions caused by declining assets, and concessions already secured by others.
Separate treatment of recovered overcharges, so money already owed to retirees is not casually treated like a newly negotiated discount.
Public reporting of findings and unresolved problems, with protections against settlements that conceal misconduct or unnecessarily waive claims.
Trustees must also compare the bounty with competitively priced alternatives. A contingent fee may reduce upfront spending, but half the recovery can still be an extraordinary price.
The same standard applies here: follow the money, disclose the conflicts and examine every manager under consistent rules.
XTP may identify meaningful savings. Kentucky should recover every dollar it can. But successful recoveries would not erase ownership conflicts, justify selective scrutiny, or establish that the remaining fees are reasonable.
Kentucky retirees should not have to wonder whether the firm investigating Wall Street’s fees is protecting a financially connected Wall Street interest.
Open the contracts. Publish the targets and the findings. Put connected firms under an independent examiner. Make every dollar of the bounty auditable.
A fee investigation that leaves the secrecy intact risks becoming one more profitable layer of the pension problem.