Professor Thomas Lambert (University of Louisville) and I wrote a paper accepted by the Journal of Economic Issues: “Safe” Annuity Retirement Products and a Possible U.S. Retirement Crisis (https://ir.library.louisville.edu/faculty/943/). One of the central contributions of the paper is a simple chart — the risk–return efficient frontier for stable value funds and annuities. For the first time, we plotted these so-called “safe” retirement products on the same terms that investment managers use to evaluate mutual funds and stocks. The results are eye-opening.
The Chart
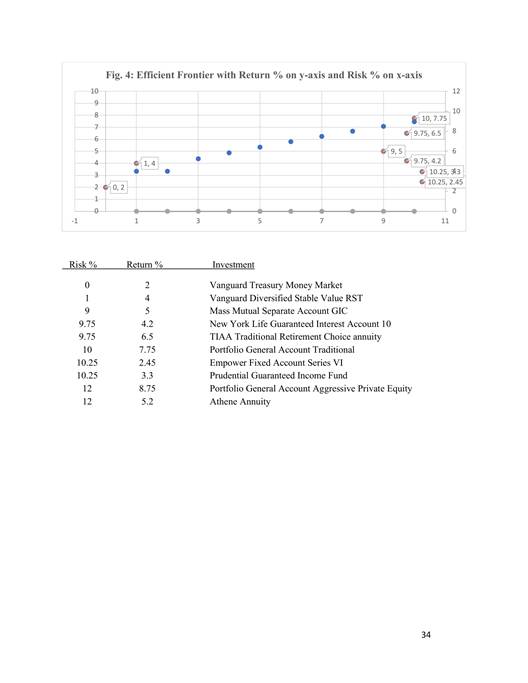
What It Shows
– Risk (x-axis): Diversified pooled products like Vanguard RST or the Hueler stable value universe sit at the low-risk end. By contrast, single-entity general account annuities (Prudential, Athene, Lincoln, etc.) fall far to the right. Actuarial evidence (Griffin, Fabozzi Handbook of Stable Value, 1998) confirms they carry ten times the risk of diversified stable value.
– Return (y-axis): Crediting rates. TIAA and the TSP G Fund are transparent; most other insurers are not. They vary rates from client to client — not by size or efficiency, but by what they think they can get away with.
Why Distances Matter
– Vertical gaps = lost earnings. Example: Valley’s plan chose Lincoln at 2.05% while peers like TIAA and MassMutual pay 4–6%. That’s measurable damages, compounded over years.
– Horizontal gaps = reckless risk. Two products may credit the same rate, but one carries ten times the credit risk. That is fiduciary malpractice.
– Distance from the efficient frontier = fiduciary breach. If a product is dominated (worse risk and worse return than available alternatives), fiduciaries cannot justify keeping it.
Why This Matters
– For participants: The “safe” annuity in your plan may actually be the riskiest product you own.
– For fiduciaries: This chart is a one-page prudence test. If your plan’s dot sits below the frontier, you are failing participants.
– For courts: Juries and judges understand pictures. The vertical drop equals lost earnings, the damages owed.
-General Account portfolio returns are estimated on the graph because even the highest yielding fixed annuity, like TIAA, still has excessive spreads of around 150 basis points.
The Transparency Problem
Outside of TIAA and the TSP G Fund, insurer rates are hidden. Consultants quietly sell access to FI360 or Hueler data, but participants can’t see what they’re earning. That opacity masks insurer spread profits and keeps fiduciaries blind.
Bottom Line
Stable value and pooled products sit on the efficient frontier. Most fixed annuities don’t. The distances between the dots aren’t abstract — they are the measure of fiduciary failure, and the dollar value of retirement savings lost.
Journal of Economic Issues Accepted 2024 Thomas E. Lambert University of Louisville, Christopher B. Tobe , ““Safe” Annuity Retirement Products and a Possible U.S. Retirement Crisis,” https://ir.library.louisville.edu/faculty/943/
The Handbook of Stable Value Investments 1st Edition by Frank J. Fabozzi 1998 Jacquelin Griffin Evaluating Wrap Provider Credit Risk in Synthetic GICs pg. 272 https://www.amazon.com/Handbook-Stable-Value-Investments/dp/1883249422
Appendix: How Disselkamp and SeaWorld Support the Legal Analysis in “The Stable Value Efficient Frontier”
I. Executive Overview
The Stable Value Efficient Frontier argues that certain stable value and insurance-backed products, including products structured with guarantees or crediting rates set by insurers, lie below the efficient frontier — meaning they offer inferior risk–return tradeoffs compared to diversified alternatives. This economic conclusion has direct legal significance because:
- ERISA’s duty of prudence requires fiduciaries to select investments that are not dominated by better alternatives;
- Legal precedent recognizes that selecting economically inferior pricing structures can constitute a fiduciary breach;
- Both Disselkamp v. Norton Healthcare and the SeaWorld Order confirm that courts view pricing inaccuracies or structural disadvantages as actionable fiduciary issues.
Below is a concise explanation of how Disselkamp and SeaWorld reinforce the legal foundations for the efficient-frontier critique.
II. Disselkamp v. Norton Healthcare — Pricing Decisions as Fiduciary Breaches
Case Core Principle:
In Disselkamp, the U.S. District Court for the Western District of Kentucky held that selecting a higher-cost mutual fund share class when identical lower-cost share classes were available can state a claim for breach of fiduciary duty under ERISA §404(a), even without proof of performance lagging an index or peer group. The key issue was the pricing decision itself:
- An inferior pricing structure was chosen;
- A superior, economically equivalent alternative was available;
- The pricing decision locked in a cost differential that persisted and compounded over time.
Legal Logic:
The court framed the decision not as a performance dispute but as a pricing/prudence failure — the fiduciaries had a duty to select an option that did not impose unnecessary cost burden on participants.
III. Why Disselkamp Matters to the Efficient Frontier Analysis
The Stable Value Efficient Frontier documents that many stable value and insurer-backed products lie below the efficient frontier of available capital-preservation options (e.g., synthetic stable value funds, diversified high-quality bond portfolios).
Under Disselkamp:
- A pricing differential between products is actionable when all other economics are comparable;
- A fiduciary’s failure to select the lower-cost option constitutes a breach of prudence;
- Losses from inferior pricing are structural and continuing, not merely attributable to market volatility.
Analogy Applied:
| Feature | Mutual Fund Share Class (Disselkamp) | Stable Value / Annuity Product |
|---|---|---|
| Economic Choice | Lower vs. higher cost share class | Higher vs. lower crediting rate |
| Pricing Variable | Expense ratio | Crediting rate / insurer spread |
| Superior Alternative | Available identical share class | Diversified stable value / bond alternative |
| Fiduciary Duty | Select lower cost | Select higher crediting / efficient product |
| Legal Harm | Ongoing cost differential | Ongoing lost earnings from rate differential |
Thus, when The Stable Value Efficient Frontier shows that a product lies below the efficient frontier, it underscores that fiduciaries have selected an inferior pricing structure, which Disselkamp deems actionable.
IV. SeaWorld Order — Extending Pricing Scrutiny Beyond Mutual Funds
Case Core Principle:
In Coppel v. SeaWorld Parks & Entertainment, Inc., a federal court in Maryland denied a motion to dismiss ERISA claims challenging the selection and retention of stable value and annuity-like products. The court held that allegations of:
- Low crediting rates,
- Undiversified and risky structures,
- Failure to consider superior alternatives,
were sufficient to survive dismissal because they plausibly alleged a breach of fiduciary duty under ERISA §404(a) and §406.
Importantly, the SeaWorld Order confirmed that:
- Challenging inferior pricing or economic terms is not a “mere performance dispute”;
- Low crediting rates and unfavorable contract terms can be the basis for a fiduciary breach claim;
- Disclosure and industry custom do not automatically cure pricing/design issues.
V. Why SeaWorld Matters to the Efficient Frontier Analysis
The Stable Value Efficient Frontier does more than identify inferior products. It demonstrates that:
- Superior alternatives exist with better risk-adjusted returns;
- Certain products’ economic positions are dominated by those alternatives;
- The decision to offer or retain these products cannot be justified as prudent when measured against the efficient frontier.
The SeaWorld Order confirms that such economic dominance is legally relevant:
- Courts will consider whether fiduciaries compared available alternatives;
- A product’s inferior position relative to the efficient frontier can support a finding that fiduciaries failed to exercise due care;
- Allegations focusing on the economic substance of the investment — not labels or tradition — satisfy pleading requirements.
Thus, SeaWorld reinforces the idea that economic comparisons like efficient frontier positioning matter legally, not just academically.
VI. Unified Legal Theory: Pricing, Prudence, and Prohibited Transactions
Combined, Disselkamp and SeaWorld support a unified legal theory:
- Pricing Decisions Are Fiduciary Decisions
- Whether framed as an expense ratio, crediting rate, or spread, pricing decisions are central fiduciary acts.
- Inferior Economics = Breach of Duty
- Selecting a product that lies below the efficient frontier is analogous to selecting a higher-cost share class.
- Continuing Harm Is Actionable
- Damages resulting from inferior pricing — whether expressed as lost earnings or unreasonable compensation — are structural and ongoing, not speculative.
- Disclosure and Custom Are Not Defenses
- Neither disclosure of a product’s features nor industry adoption immunizes fiduciaries from liability for inferior pricing choices.
- Prohibited Transactions Are Strengthened
- When the inferior pricing benefits a party in interest (e.g., insurer spread revenues), the combination of pricing breach and party-in-interest status supports prohibited transaction claims under ERISA §406.
This unified theory directly supports the conclusions in The Stable Value Efficient Frontier that:
- Certain stable value and annuity products are economically dominated;
- Fiduciaries have a duty to select superior alternatives;
- Failure to do so is actionable under ERISA.
VII. Conclusion
The efficient frontier analysis provides a quantifiable, economic basis for identifying inferior pricing products.
Disselkamp and SeaWorld confirm that inferior pricing decisions are not abstract academic critiques — they form a legally cognizable basis for fiduciary breach and prohibited transaction claims under ERISA.
In litigation, plaintiffs can leverage:
- Efficient frontier charts to show economic dominance of alternatives;
- Share-class analogies under Disselkamp to frame pricing harm;
- SeaWorld’s rejection of industry-custom defenses to withstand motions to dismiss.
Together, these authorities transform the efficient frontier from an academic tool into a legal foundation for ERISA claims against stable value and annuity products.
Appendix: Why Evergreen Fixed Annuities Must Be Evaluated Against 7- and 10-Year Rates on the Stable Value Efficient Frontier (2/2/26)
I. The Core Fiduciary Error: Treating Evergreen Products as Short-Term Investments
Most fixed annuities offered inside 401(k) plans—whether labeled “stable value,” “fixed account,” or “guaranteed interest fund”—are evergreen contracts:
- They have no stated maturity date at which principal must be returned.
- They restrict exits through multi-year withdrawal schedules, market-value adjustments, or employer-level termination rules.
- They expose participants to ongoing single-insurer credit risk and insurer discretion over crediting.
Economically, these products do not behave like cash, money-market funds, or even 1- to 5-year instruments. They behave like intermediate- to long-duration credit exposures with limited liquidity.
From an efficient-frontier perspective, this distinction is decisive.
II. Efficient Frontier Analysis Requires Duration and Liquidity Matching
A core principle of modern portfolio theory—and of fiduciary prudence—is that comparisons must control for:
- Time horizon / duration
- Liquidity and exit rights
- Credit concentration risk
Comparing an evergreen annuity to a 1-year or even 5-year instrument systematically understates the return a prudent fiduciary should demand for accepting:
- indefinite commitment,
- reduced liquidity,
- opaque pricing,
- and single-entity insurer risk.
Accordingly, the correct benchmark on the stable value efficient frontier is not a short-term rate, but an intermediate- or long-term rate, typically 7 years or 10 years.
III. Market Evidence: What Investors Are Paid for 7- and 10-Year Commitments
Retail markets provide transparent evidence of what insurers themselves must pay when they compete for true long-term commitments.
As of recent periods:
- 7-year fixed annuities have been offered at approximately 6.90%.
- 10-year fixed annuities have been offered at approximately 7.65%.
- (October 2025 retireguide.com )
These rates reflect retail Multi-Year Guaranteed Annuities (MYGAs)—products where the investor knowingly commits funds for a defined long term and is compensated accordingly.
These rates represent market-clearing prices for long-duration annuity capital, not hypothetical or academic benchmarks.
When a 401(k) plan offers an evergreen annuity crediting 2%–3%, the product lies far below the efficient frontier relative to what the same insurers pay in retail channels for comparable or shorter commitments.
IV. Where 5-Year CDs Fit on the Efficient Frontier
Certificates of Deposit help illustrate the lower bound of the efficient frontier for capital-preservation assets.
Historical data from the Federal Reserve and FDIC show that:
- 5-year CD rates have typically ranged from roughly 1%–2% in low-rate environments to 4%–5%+ in higher-rate environments.
- CDs provide full principal preservation, defined maturity, and FDIC insurance, with none of the credit opacity or lock-in found in annuities.
Because 5-year CDs:
- have shorter duration,
- offer clear maturity and liquidity,
they should plot returns below 7- and 10-year annuity rates on the efficient frontier—but way lower on risk than low-crediting evergreen annuities that impose longer-term risk without commensurate return.
In other words:
- A low-rate evergreen annuity can be inferior even to a 5-year CD rate despite much higher risk,
- and is dramatically inferior to market-priced 7- and 10-year annuities.
V. Efficient Frontier Implication: Evergreen Annuities Are Often Dominated Assets
Putting these instruments on the same efficient frontier reveals a clear ordering:
| Instrument | Liquidity | Effective Term | Typical Market Rate |
| Money Market / Short-Term Cash | Daily | <1 year | 1-4% |
| 5-Year CD | High (at maturity) | 5 years | 2-4% |
| 7-Year Retail Annuity | Low | 7 years | ~6.9% |
| 10-Year Retail Annuity | Very Low | 10 years | ~7.65% |
| Evergreen 401(k) Fixed Annuity | Restricted | Indefinite | 2%–3% (typical) |
An evergreen annuity that:
- restricts exits,
- concentrates credit risk,
- and offers materially lower returns than even shorter-term alternatives,
is economically dominated. On an efficient frontier chart, it plots below and to the right of readily available alternatives—precisely the outcome fiduciary law is designed to prevent.
VI. Fiduciary Consequences
From a fiduciary standpoint:
- Accepting short-term yields for long-term risk violates basic prudence.
- Duration mismatch is not conservative; it is uncompensated risk.
- Disclosure does not cure an investment that lies below the efficient frontier.
- When the insurer capturing the spread is a party in interest, the pricing failure also supports prohibited transaction claims.
The efficient frontier analysis thus provides a quantitative, economically grounded framework for evaluating evergreen annuities—one that courts already understand from share-class and pricing cases.
VII. Bottom Line
Since most fixed annuities offered in 401ks have no maturity and cannot be exited freely at par, it must be evaluated against intermediate- and long-term rates—typically 7- and 10-year benchmarks—not short-term cash yields.
Measured correctly, many 401(k) fixed annuities fail this test and sit well below the stable value efficient frontier.
Sources
- Retail 7- and 10-Year Fixed Annuity Rates (MYGAs) – RetireGuide
- FDIC / Federal Reserve historical CD rate data (5-year CDs)

Well done! Yet another example of plan sponsors unnecessarily exposing themselves to fiduciary liability by not understanding a product and actually hurting employees by drinking the annuity industry’s Kool-aid
Yahoo Mail: Search, Organize, Conquer
LikeLike
Pingback: How Damages Are Calculated in 401(k) Plans | The CommonSense 401k Project
Pingback: Stable Value: Why General Account and Separate Account Products Are ERISA Prohibited Transactions — and Why Diversified Synthetic Stable Value Is Not | The CommonSense 401k Project
Pingback: Fixed Annuities Have Comparables. They Do Not Have Benchmarks. | The CommonSense 401k Project