Private Equity Is Being Added on Top of Private Debt, Private Real Estate, Annuities and State-Regulated CITs
By Christopher Tobe, CFA,CAIA
The CommonSense 401k Project
Principal Financial Group has announced that it is expanding its “Featured Partner Program” to bring private markets into retirement plans.
This is being marketed as broader diversification and better long-term retirement outcomes. I see something very different: Principal is building a distribution system that can add private equity on top of the private debt, illiquid private real estate, insurance separate accounts, annuity contracts and state-regulated collective investment trusts already found across its retirement platform.
Principal is not new to private debt. Principal Alternative Credit reported nearly 40 direct-lending transactions representing more than $750 million of committed capital in 2021 and described an expansion of its private-debt capabilities. (Principal announcement). The 2026 Featured Partner expansion creates a route for Principal and outside managers to package private-market strategies for defined-contribution plans.
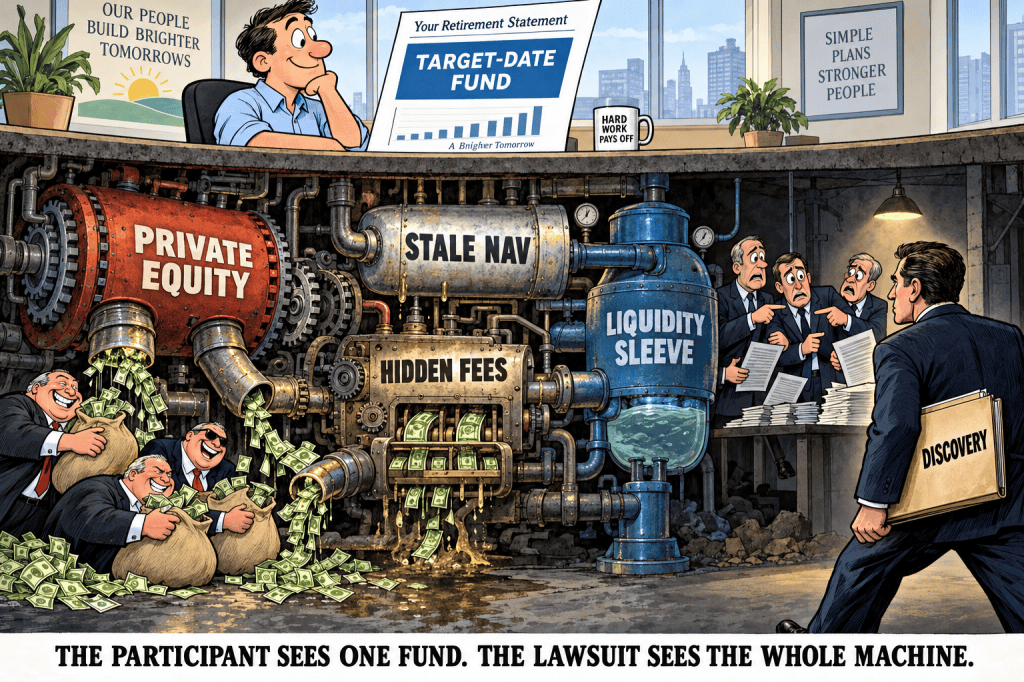
The participant may see one friendly label—perhaps “Target Date 2050.” Underneath it could be layer after layer of contracts, managers, affiliated entities, subjective valuations, liquidity devices and fees.
This is not diversification in any commonsense meaning of the word. It is an illiquidity and opacity layer cake.
And Principal’s own announcement practically writes the first paragraph of the future complaint.
Principal Admits Participants May Not Be Able to Get Their Money
Principal’s August 26 announcement says it plans to collaborate with asset managers, trust companies and fiduciaries to launch a “suite” of CITs combining public and private strategies. The possible delivery systems include CIT-based target-date funds, target-risk funds, managed accounts and other asset-allocation services.
The list of participating private-market firms is a Wall Street greatest-hits collection: AllianceBernstein, Apollo, Ares, Blackstone, Blue Owl, Carlyle, Franklin Templeton, Goldman Sachs, KKR, Morgan Stanley Investment Management, Neuberger, Partners Group, PGIM and Principal Asset Management.
Then, near the bottom of the release, comes the disclosure every plan fiduciary should read slowly:
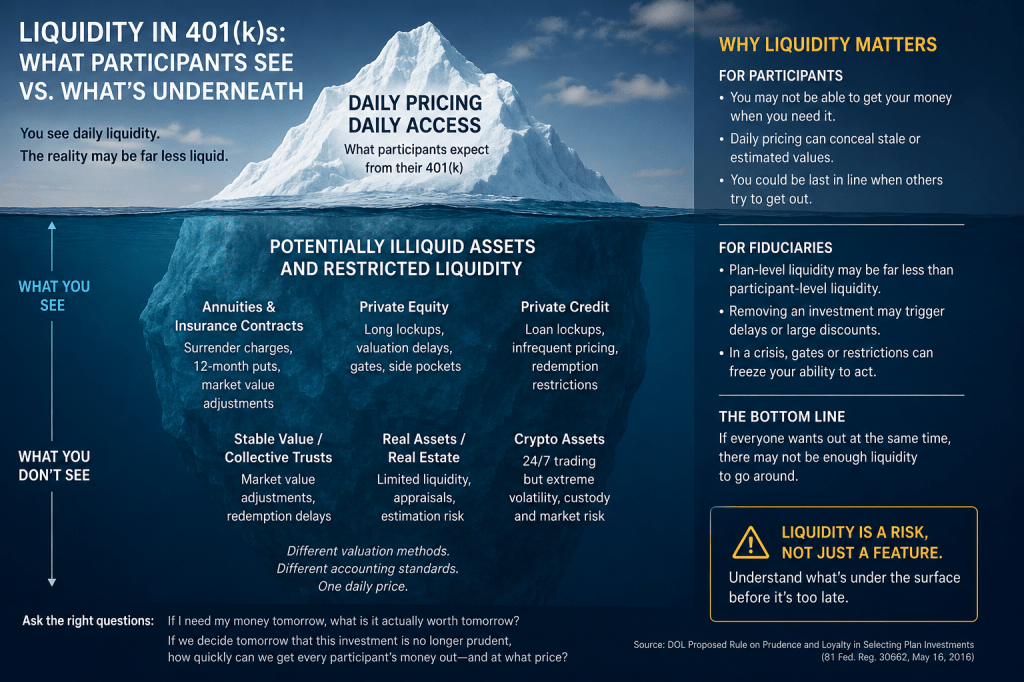
Because certain private equity investments are less liquid, the investment manager seeks to accommodate daily participant activity using other underlying investments intended to support routine contributions, withdrawals, and rebalancing. However, in some circumstances, transaction processing may be delayed, partially completed, or temporarily unavailable due to fund-level liquidity or valuation conditions.
That is not my characterization. That is Principal’s own warning.
Translated into plain English: the private assets are not daily liquid. The participant’s apparent daily access depends on other, more liquid investments being available to absorb withdrawals. If liquidity or valuation conditions deteriorate, the participant’s transaction may be delayed, only partly completed or made temporarily unavailable.
Principal calls this making private markets “more practical” for retirement plans. I call it using workers’ liquid retirement savings as the liquidity sleeve for Wall Street’s illiquid contracts.
This Is Not Yet One Fully Disclosed Product—It Is a Product-Building and Distribution Architecture
Principal’s announcement does not identify one completed investment with a prospectus-like package of facts. It announces a program and a future suite.
The release does not tell us:
- the private-equity allocation;
- the size or composition of each liquidity sleeve;
- the complete fee stack;
- the carried-interest terms;
- the valuation policy or valuation lag;
- the leverage and subscription-line exposure;
- the identity and chartering jurisdiction of every CIT trustee;
- the authority to gate or delay participant transactions;
- the recordkeeper exit and portability terms;
- the allocation of fiduciary responsibility; or
- whether Principal’s recordkeeping economics improve when a plan selects a Featured Partner product.
Those are not minor details. Those details are the investment.
Dr. Brian Leite recently explained that a participant may see one fund while the fiduciary must oversee an ecosystem: sponsor, committee, CIT trustee, allocation manager, private-market manager, underlying funds, valuation process, liquidity sleeve and recordkeeper. His question is exactly right: who is actually responsible for what?
In litigation, I would add three more questions at every layer:
- Who exercised discretion?
- Who got paid?
- What contemporaneous document proves the decision benefited participants rather than Principal and its distribution partners?
Principal Was Already Layered Before It Added Private Equity
I first called Principal’s target-date structure a “Toxic Target Date” in 2022.
At that time, I identified a Principal target-date lineup using 13 underlying funds: five insurance-company separate accounts, four CITs and four proprietary mutual funds—with 25 share classes in the structure. Principal also disclosed exposure to nontraditional and alternative strategies, including real estate and hedge-fund strategies.
Now Principal proposes to add private equity through still more CIT-based structures.
Picture the possible chain:
Participant → target-date or managed-account solution → top-level CIT → private-market CIT or underlying fund → private-equity partnership → portfolio company.
Alongside that chain may sit:
- a Principal Life group annuity contract;
- Principal insurance separate accounts;
- private commercial real estate;
- private or less-liquid debt;
- stable-value contracts;
- public funds used as a liquidity sleeve;
- multiple managers and trustees; and
- Principal as recordkeeper and platform operator.
Every additional layer creates another place to hide fees, shift valuation responsibility, impose contractual restrictions or disclaim fiduciary status.
Principal’s Private Real Estate Already Shows How the Liquidity Promise Can Fail
Principal does not need to imagine the liquidity problem. It already sells it.
Principal describes its U.S. Property Separate Account as an investment that primarily owns private-equity commercial real estate rather than exchange-traded securities. Its disclosure says investors may not be able to withdraw immediately because real estate sales are time-consuming and market conditions may delay or prevent them. Principal says a pre-existing contractual limitation in the group annuity contract may be used to satisfy withdrawal requests proportionately over time. (Principal disclosure).
Principal’s broader comparison of investment structures states that separate accounts are governed by group annuity contracts and overseen by state insurance departments. It also says Principal Life reserves the right to defer payments or transfers from its separate accounts under the group annuity contracts. (Principal investment-type comparison).
Now add private equity to that ecosystem.
What happens when the private-real-estate account is limiting withdrawals, private-credit marks are stale, private-equity distributions dry up and older workers are simultaneously moving or withdrawing money from the target-date fund?
Does the manager sell the publicly traded assets first?
If so, early redeemers get cash while the remaining participants are left with a more illiquid and difficult-to-value portfolio. That is a classic first-mover advantage and a potential participant-to-participant wealth transfer.
Calling the remaining liquid assets a “liquidity sleeve” does not solve this problem. It merely gives the problem a friendlier name.
State-Regulated CITs Are the Escape Route
Principal’s announcement specifically says the new private-market products will use CITs. That matters.
Principal itself explains that CITs are not mutual funds, are exempt from registration under the Investment Company Act of 1940 and do not give investors the protections of that Act. Principal’s materials say state-chartered CITs are generally governed by state trust laws and state banking regulators, while others may be regulated by the OCC.
Existing Principal LifeTime Hybrid CIT materials identify Principal Global Investors Trust Company as trustee, Principal Global Investors as the affiliated adviser, and state that the adviser and other affiliates may receive fees. They also state that the CITs are not registered with the SEC, the State of Oregon or any other regulatory body. (Principal LifeTime Hybrid CIT disclosure).
That language does not mean the trust company operates without any legal oversight. But it does mean participants do not receive the same federal securities-law structure, public filings, independent-board framework and standardized disclosure regime they would receive in an SEC-registered mutual fund.
I recently proposed a simple CommonSense test for private assets in a 401(k):
Could this exact contract survive inside an SEC-registered mutual fund?
Same fees. Same leverage. Same GP valuation. Same liquidity. Same gates. Same carry. Same side letters. Same affiliated transactions. Same accounting.
If not, why is the answer to find a state-regulated CIT rather than to reject the contract for a participant-directed retirement plan?
Principal’s “Featured Partner” Economics Need Discovery
Principal says the program will create value for financial professionals, plan sponsors and participants. It does not quantify who receives what value.
Principal’s platform disclosures show why fiduciaries cannot accept vague assurances. One Principal disclosure says some Featured Partner investments may qualify a plan for discounted recordkeeping fees if selected in a RetireView model. The same disclosure says an independent 3(21) fiduciary deems the option appropriate through a proprietary screening process and says the investment manager may not be paying Principal an annual inclusion fee.
“May not” is not a compensation disclosure.
Every plan considering one of these private-market products should demand:
- the complete 408(b)(2) disclosures;
- all direct and indirect compensation to Principal and every affiliate;
- platform, connectivity, data and distribution payments;
- any recordkeeping discount tied to product selection;
- compensation to the 3(21) fiduciary and the complete proprietary screening methodology;
- payments among the manager, trustee, recordkeeper and consultant;
- every underlying management fee, performance allocation and portfolio-company fee; and
- the percentage of gross investment gain ultimately retained by participants.
If selecting a Featured Partner product lowers a sponsor’s visible recordkeeping bill by moving compensation into an opaque investment layer, that is not a bargain. It is cost-shifting—and potentially a loyalty and prohibited-transaction problem.
The Annuity Layer Creates a Separate ERISA Problem
Principal’s retirement platform is not merely an investment marketplace. Principal Life Insurance Company provides insurance products and plan administrative services, and its separate accounts are accessed through group annuity contracts.
Principal’s own materials state that all voting rights associated with mutual-fund shares held through a separate account belong to the separate account—not to the contractholders. They also state that Principal Life is the “Investment Manager” under ERISA for some separate-account assets.
That makes it essential to identify who owns the assets, who exercises authority, who receives the spread or other compensation and whether plan transactions benefit a party in interest or fiduciary.
My position remains that most fixed annuity arrangements in ERISA plans present prohibited-transaction problems. Adding private equity does not cure those problems. It can bury them under another CIT, another manager and another set of disclosures.
After Cunningham v. Cornell University, plan fiduciaries cannot responsibly wave away ERISA §406 concerns by assuming an exemption. They should identify the transaction and parties in interest, state the exemption being relied upon, and prove every condition—including reasonable compensation and adequate disclosure.
Principal Is Selling Complexity—and Handing the Liability to Plan Sponsors
Principal boasts of $114 billion in target-date assets and more than two decades of supporting private assets on its recordkeeping platform. Scale does not make a conflicted or opaque structure prudent. It makes the potential participant exposure larger.
The old Principal disclosure I highlighted in 2022 said the ultimate decision whether a LifeTime Hybrid CIT is appropriate—and whether it may serve as a QDIA—belongs to the plan fiduciaries.
My translation then was blunt: if the sponsor is willing to buy the high-fee, high-risk product, Principal will tell the sponsor the liability is theirs.
Leite’s delivery-chain analysis makes that warning even more important. In a future lawsuit, each provider may point to its contract:
- the recordkeeper only processed transactions;
- the private-equity manager only managed the underlying assets;
- the allocation manager selected the sleeve;
- the valuation agent relied on manager-supplied data;
- the trustee relied on delegated expertise;
- the 3(21) adviser merely gave advice; and
- the plan committee made the final decision.
That is why fiduciaries must follow the authority, the money and the disclaimers before investing—not after participants are gated or losses finally appear in the marks.
Questions Every Principal Client Should Ask Now
Before approving any Principal Featured Partner private-market product, I would demand written answers to these questions:
- Identify every legal entity, contract, fund and fiduciary in the delivery chain.
- Identify the trustee and chartering regulator for every CIT layer.
- Show the private-equity, private-credit, private-real-estate and annuity exposure at every point on the glide path.
- Show the age and source of every private valuation used in the daily unit price.
- Show the liquidity sleeve, its opportunity cost and stress tests under simultaneous withdrawals and market declines.
- State exactly when participant transactions can be delayed, partially completed, gated or suspended.
- Reconcile every fee and dollar of compensation through every layer.
- Disclose every recordkeeping discount or platform benefit tied to selecting the product.
- Identify every affiliate and party in interest and the prohibited-transaction exemption relied upon.
- Show a net-of-all-fees public-market-equivalent analysis for the entire target-date product—not merely the private-equity sleeve.
- Explain whether the product can move to another recordkeeper in kind and what an exit would cost.
- Produce the legal opinion explaining why this exact arrangement is prudent and compliant for this specific plan and participant population.
Conclusion: Principal Is Not Democratizing Private Equity—It Is Industrializing Opacity
Principal is combining its enormous retirement recordkeeping platform with private-market managers, trust companies, CITs, target-date funds, managed accounts and existing insurance structures.
That may be an impressive distribution machine. It is not automatically an appropriate retirement investment.
Participants already face Principal structures containing affiliated funds, CITs, insurance separate accounts, private commercial real estate and contractual withdrawal restrictions. Adding Apollo, Blackstone, Blue Owl, Carlyle, KKR and the rest of the private-equity industry does not simplify that structure. It adds valuation subjectivity, leverage, carried interest, long lockups and another layer of parties trying to get paid.
Principal’s own warning says participant transactions may be delayed, partly completed or temporarily unavailable.
Plan fiduciaries should believe that warning.
And plaintiffs’ lawyers should save it.
This article expresses the author’s opinions and is intended for education and fiduciary-governance discussion. It is not legal advice. The legal status of any product or transaction depends on its specific documents, parties, compensation and facts.